File:118 fig1.jpg
Jump to navigation
Jump to search

Size of this preview: 800 × 571 pixels. Other resolution: 1,008 × 720 pixels.
Original file (1,008 × 720 pixels, file size: 101 KB, MIME type: image/jpeg)
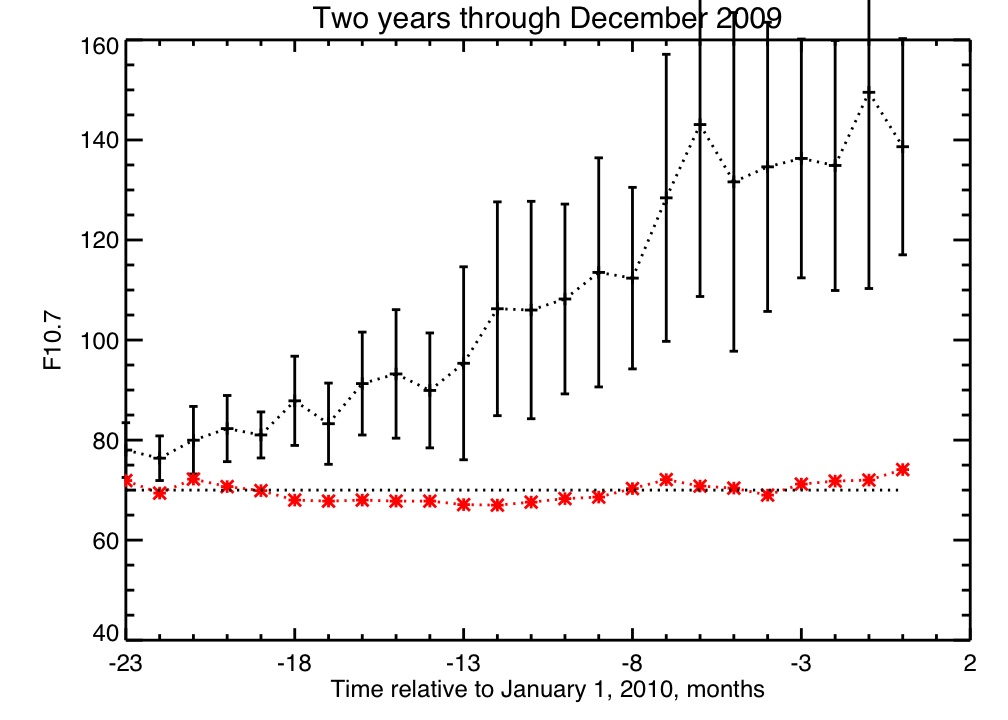
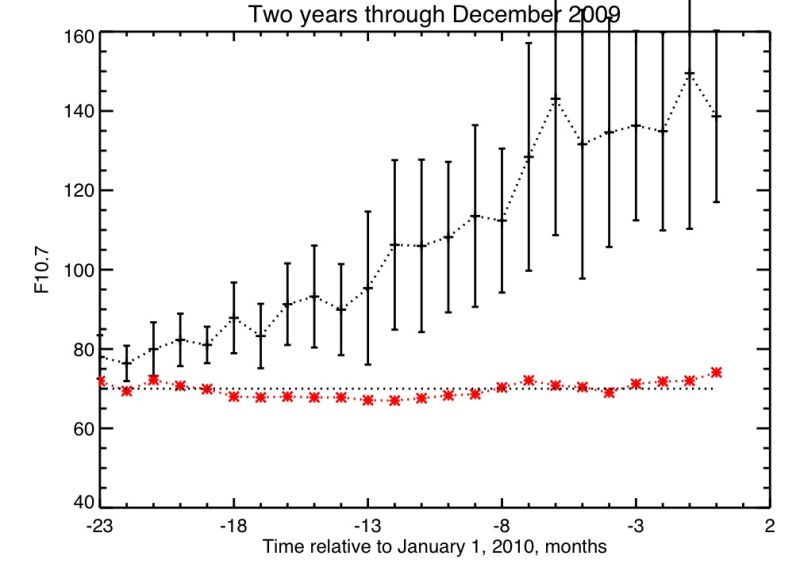
The F10.7 index of solar activity, shown as a superposed-epoch analysis of the data since 1947. The points with the range bars show the previous cycle onsets, keyed to the times of maximum just preceding each minimum. The red points are the current data, keyed to the last maximum. The dotted line is for reference.
File history
Click on a date/time to view the file as it appeared at that time.
| Date/Time | Thumbnail | Dimensions | User | Comment | |
|---|---|---|---|---|---|
| current | 14:33, 1 November 2024 | | 1,008 × 720 (101 KB) | Maintenance script (talk | contribs) | == Summary == Importing file |
You cannot overwrite this file.
File usage
The following page uses this file: