File:179fig1.png
Jump to navigation
Jump to search

Size of this preview: 800 × 400 pixels. Other resolution: 1,889 × 945 pixels.
Original file (1,889 × 945 pixels, file size: 42 KB, MIME type: image/png)
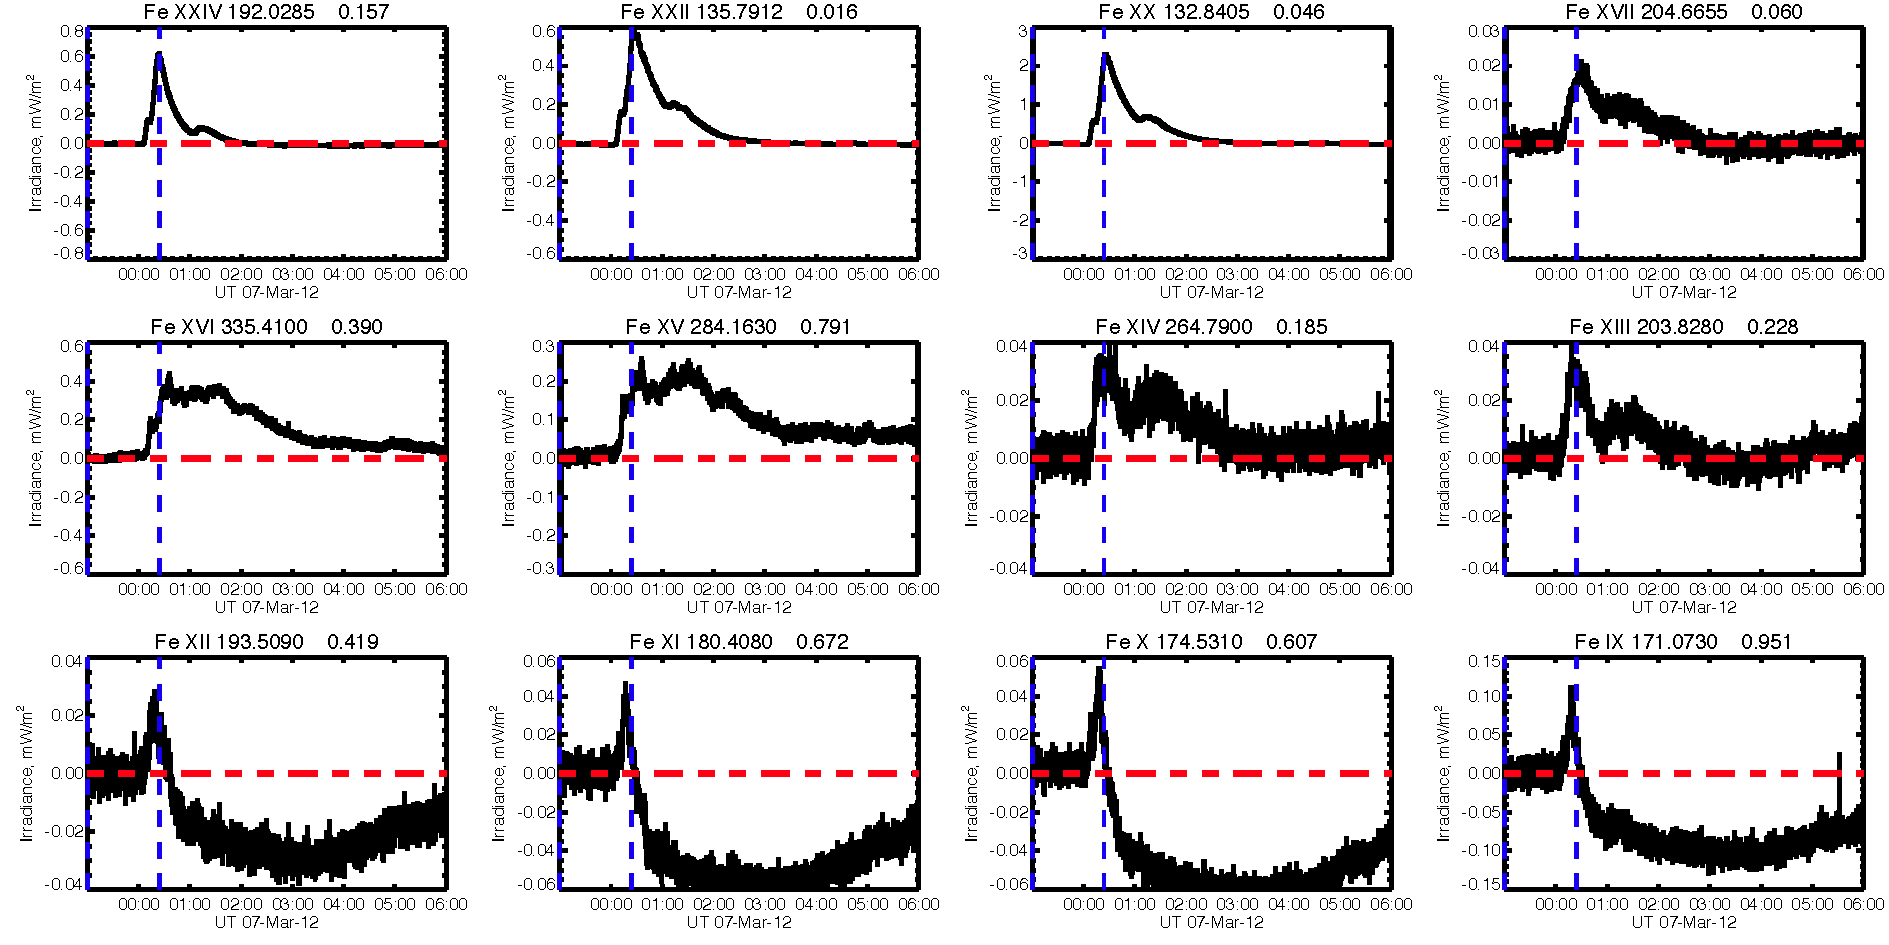
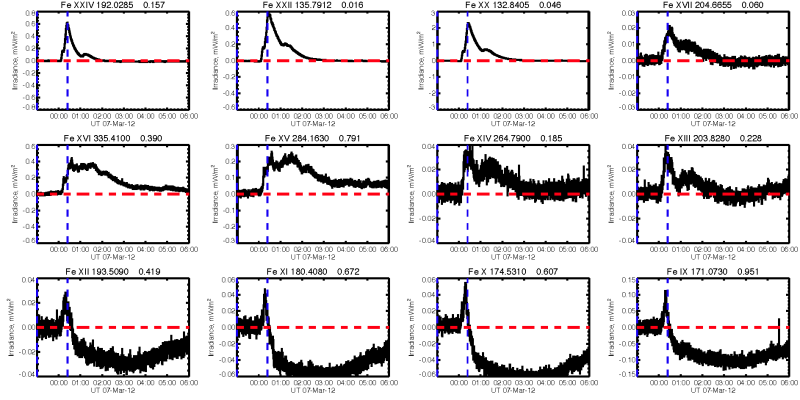
Figure 1: An "Fe cascade" plot showing the time variations of various ionization states of iron, from Fe XXIV (Fe+23) in the upper left, to Fe IX (Fe+7) in the lower right. These represent different temperatures; the high-temperature stages show emission from coronal loops during the flare, and the low-temperature stages show the dimming resulting from the evacuation of the corona by the CME associated with the flare SOL2012-03-07.
File history
Click on a date/time to view the file as it appeared at that time.
| Date/Time | Thumbnail | Dimensions | User | Comment | |
|---|---|---|---|---|---|
| current | 14:35, 1 November 2024 | | 1,889 × 945 (42 KB) | Maintenance script (talk | contribs) | == Summary == Importing file |
You cannot overwrite this file.
File usage
The following page uses this file: