File:192f2.jpg
Jump to navigation
Jump to search

Size of this preview: 800 × 383 pixels. Other resolution: 1,484 × 710 pixels.
Original file (1,484 × 710 pixels, file size: 241 KB, MIME type: image/jpeg)
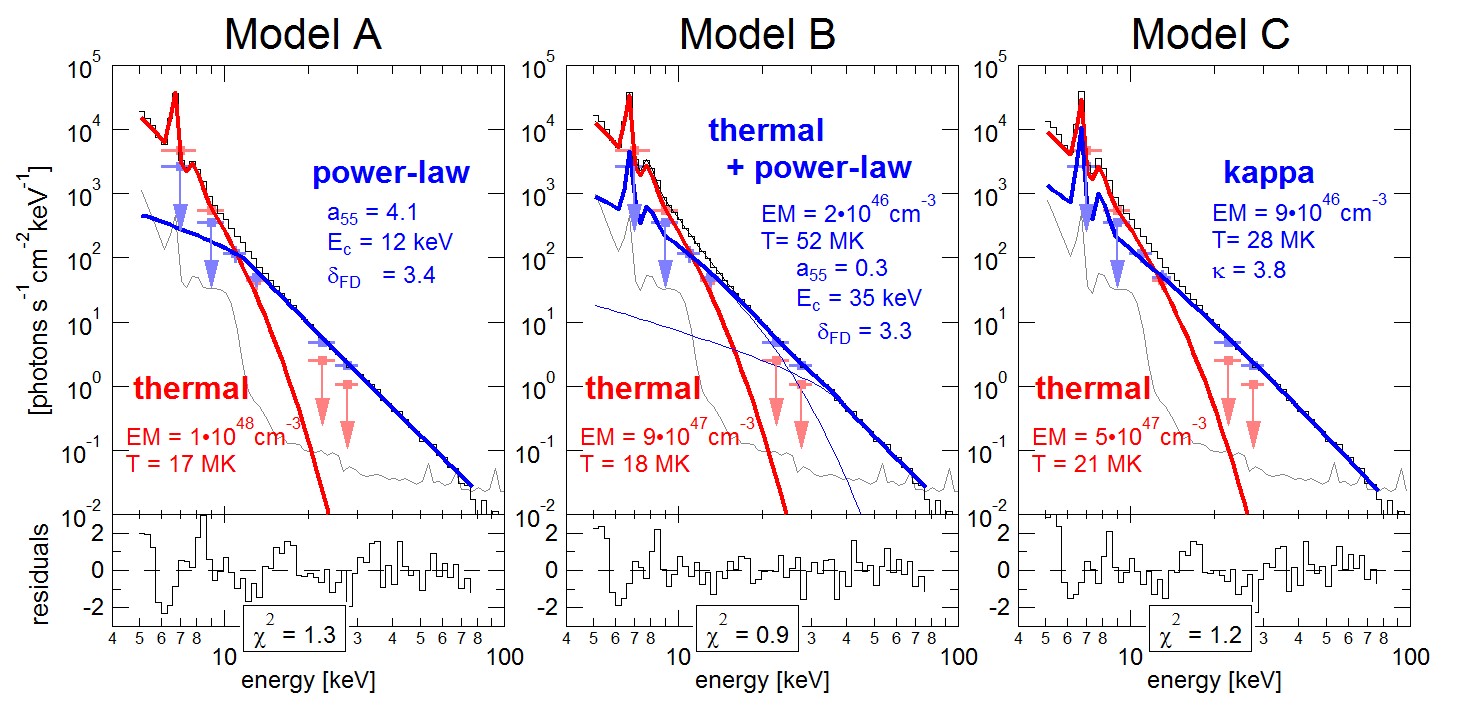
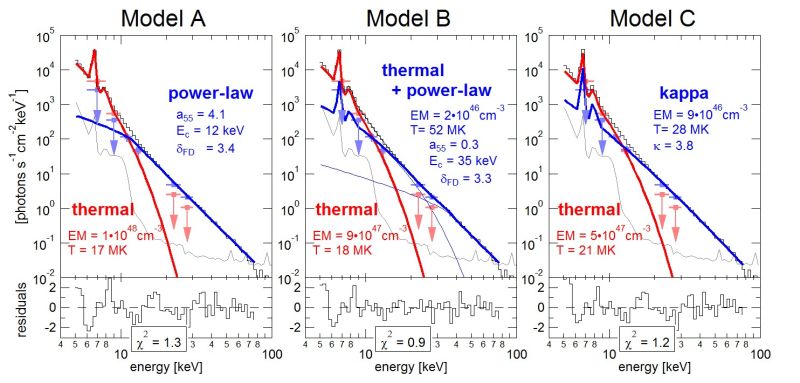
Figure 2: Comparison of the observed spatially integrated photon spectrum (histograms) with modeled distributions (solid curves) as well as the imaging spectroscopy result (light-red and light-blue squares for the northern and southern sources, respectively). Three different sets of models were used to fit the observed spectrum.
File history
Click on a date/time to view the file as it appeared at that time.
| Date/Time | Thumbnail | Dimensions | User | Comment | |
|---|---|---|---|---|---|
| current | 14:35, 1 November 2024 | | 1,484 × 710 (241 KB) | Maintenance script (talk | contribs) | == Summary == Importing file |
You cannot overwrite this file.
File usage
The following page uses this file: