File:195f1.png
Jump to navigation
Jump to search

Size of this preview: 629 × 600 pixels. Other resolution: 1,484 × 1,415 pixels.
Original file (1,484 × 1,415 pixels, file size: 653 KB, MIME type: image/png)
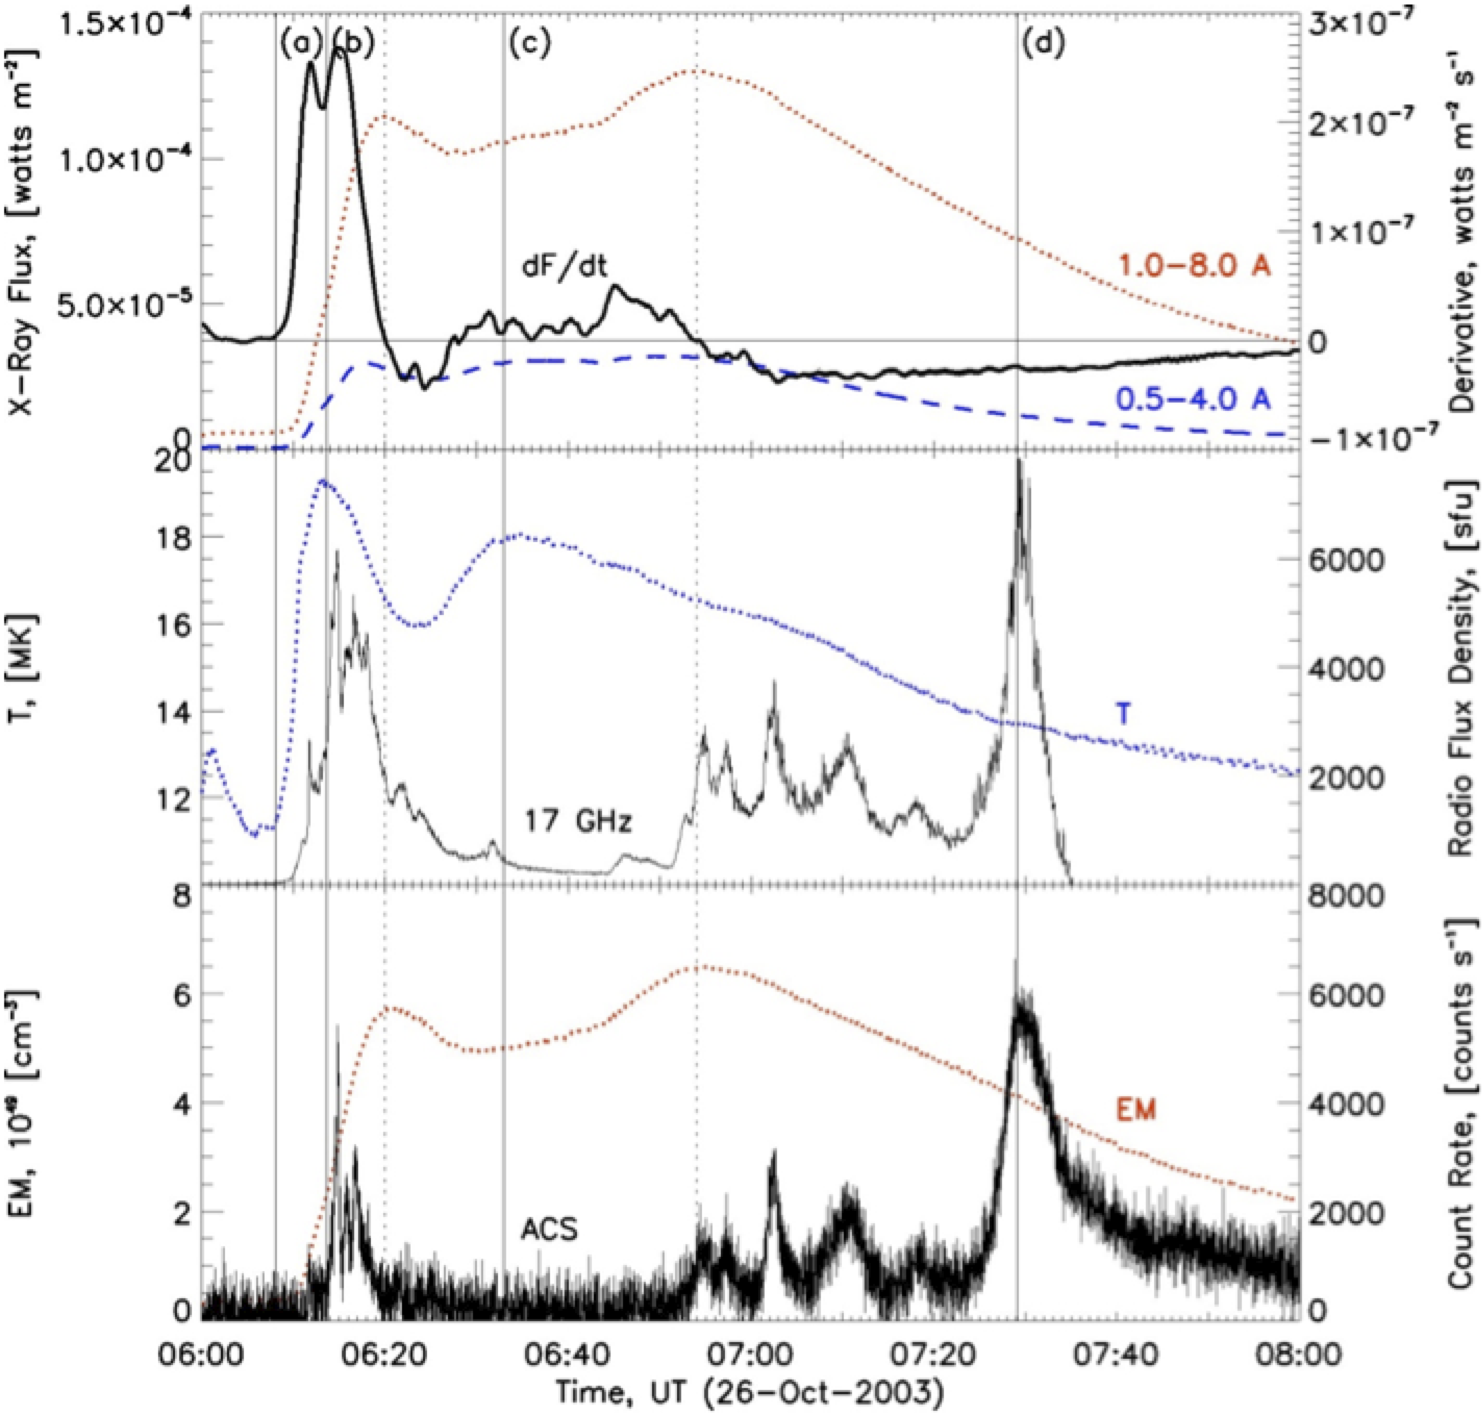
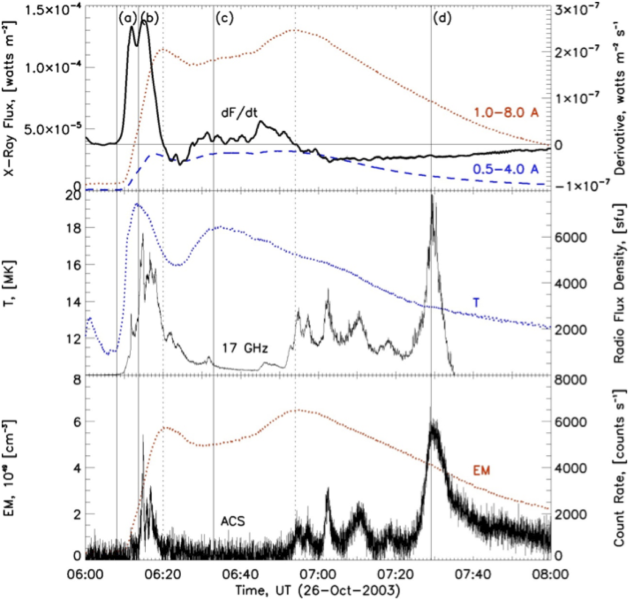
The timing of the BOT (about 07:30 UT). Upper panel: Fluxes of X-ray emission detected by GOES in two spectral channels and the smoothed time derivative of X-ray flux in the 1-8 A channel. Middle panel: Temperature of the flare plasma estimated from the GOES data, and flux density of solar radio emission detected by Nobeyama Radio Polarimeter at 17 GHz. Bottom panel: Emission measure of the flare plasma estimated from the GOES data and count rates from the ACS SPI. Lines (a, b, c and d) mark the moments presented in Figure 2.
File history
Click on a date/time to view the file as it appeared at that time.
| Date/Time | Thumbnail | Dimensions | User | Comment | |
|---|---|---|---|---|---|
| current | 14:35, 1 November 2024 | | 1,484 × 1,415 (653 KB) | Maintenance script (talk | contribs) | == Summary == Importing file |
You cannot overwrite this file.
File usage
The following page uses this file: