File:Fig06.png
Jump to navigation
Jump to search

Size of this preview: 800 × 215 pixels. Other resolution: 1,508 × 405 pixels.
Original file (1,508 × 405 pixels, file size: 83 KB, MIME type: image/png)
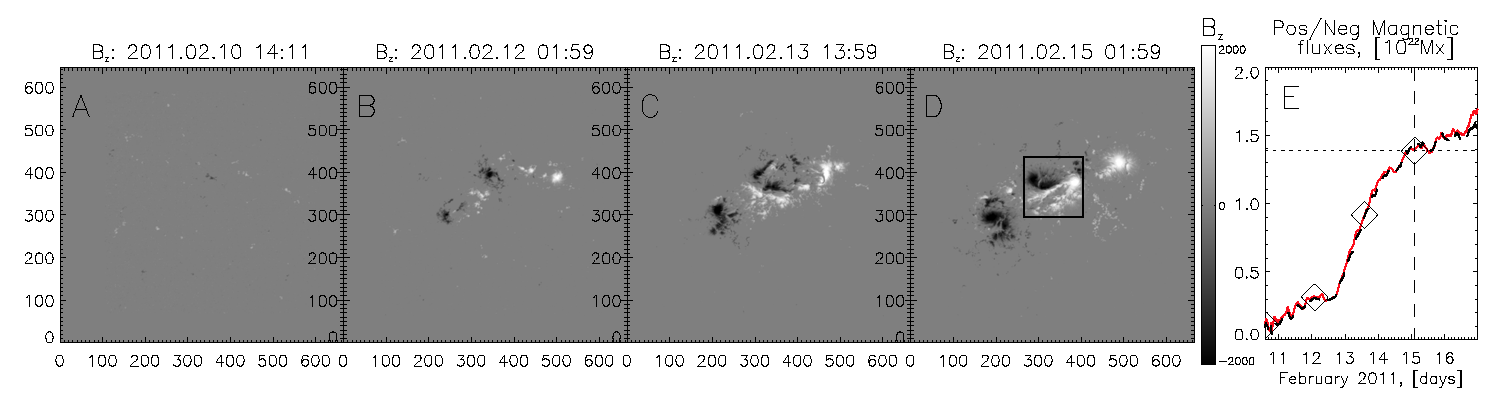
Figure 1: (A)–(D): HMI vertical magnetic field (Bz) maps at four different times of NOAA 11158 evolution. Panel (E): positive/negative vertical magnetic fluxes during the 6-day interval. Diamonds indicate the times of images on the left. An X2.2 flare is marked with the dashed line.
File history
Click on a date/time to view the file as it appeared at that time.
| Date/Time | Thumbnail | Dimensions | User | Comment | |
|---|---|---|---|---|---|
| current | 14:34, 1 November 2024 | 1,508 × 405 (83 KB) | Maintenance script (talk | contribs) | == Summary == Importing file |
You cannot overwrite this file.
File usage
The following page uses this file: