From Chromospheric Evaporation to Coronal Rain: An Investigation of the Mass and Energy Cycle of a Flare: Difference between revisions
(No. 487 initial upload) |
No edit summary |
||
| Line 3: | Line 3: | ||
|title = From Chromospheric Evaporation to Coronal Rain: An Investigation of the Mass and Energy Cycle of a Flare | |title = From Chromospheric Evaporation to Coronal Rain: An Investigation of the Mass and Energy Cycle of a Flare | ||
|number = 487 | |number = 487 | ||
|first_author = Seray & | |first_author = Seray ŞAHIN | ||
|second_author = Patrick ANTOLIN | |second_author = Patrick ANTOLIN | ||
|publish_date = 3 February 2025 | |publish_date = 3 February 2025 | ||
Revision as of 20:55, 1 February 2025
| Nugget | |
|---|---|
| Number: | 487 |
| 1st Author: | Seray ŞAHIN |
| 2nd Author: | Patrick ANTOLIN |
| Published: | 3 February 2025 |
| Next Nugget: | TBD |
| Previous Nugget: | Energetic neutral atoms detected in the large solar energetic particle event of February 2022 |
Introduction
Solar flares, driven by magnetic reconnection, release immense energy, heating the plasma and triggering chromospheric "evaporation" (a rapid upward flow of material into the corona). Conversely, coronal rain is a fascinating phenomenon observed in the Sun's corona, characterized by the condensation and subsequent gravitational descent of cool, dense, and partially ionised plasma back to the solar surface.
Observational Data
In Ref. [1] we described the first large-scale statistical comparison of quiescent and flare-driven coronal rain over an active region off-limb with the Interface Region Imaging Spectrograph (IRIS) and Solar Dynamics Observatory (SDO) instruments, covering chromospheric to transition-region (TR) temperatures. Furthermore, we also analysed chromospheric evaporation with the same instruments, comparing its mass and energy flux to that of coronal rain.

We first examine the pre-flare and gradual phases, where we observe the quiescent and flare-driven coronal rain. We obtained the average spatial mean angle maps obtained from the Rolling Hough Transform (RHT; Ref. [2]) algorithm during the pre-flare and gradual phases (see Figure 1). The coloured pixels on these maps correspond to the coronal rain. We examine the relationship between the detected rain pixel number and coronal rain intensity and found that both quantity and intensity increase by a factor of ~ 3. Moreover, for both the pre-flare and gradual phases, the width of the rain clumps remains uniform as they fall along the loop (see Figure 1; right plots), suggesting that the factor influencing rain width is unaffected by the varying thermodynamic conditions with height (e.g., progressive cooling or increased compression downstream from the rain).
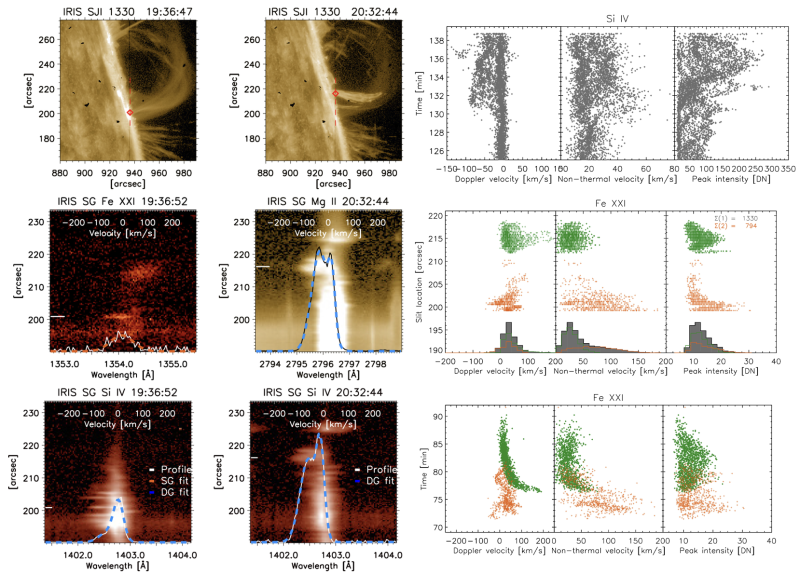
The IRIS data allow us to study Doppler shifts and line profiles, as seen in Figure 2.

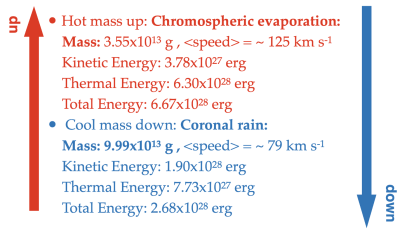
We examined the mass and energy cycle of the flare, distinguishing its impulsive phase - when "evaporation" happens - and the gradual phase, with downflows out of the loop. We found that total mass going down (due to coronal rain) ~ 3 times larger than the mass pushed up (due to chromospheric evaporation). Regarding the energy budget, we found that coronal rain energy corresponds to roughly half of the chromospheric evaporation energy, with the other half probably converted into heat. We also found that magnetic energy dissipation is consistent with thermal energy of flare, suggesting that rain gas pressure can be used as proxy for flare field strengths. Figure 3 summarizes this comparison.
Conclusion
Our analysis reveals key insights into the transition from quiescent to flare-driven coronal rain and its connection to chromospheric evaporation.
• The transition from quiescent to flare-driven coronal rain is marked by a significant increase in both quantity and intensity of rain events.
• The widths of coronal rain remain unchanged during this transition, suggesting a fundamental MHD process linked to thermal instability.
• Spectral analysis reveals the presence of magnetic shear near the footpoints of the loops, indicating localized magnetic complexity.
• The widths of chromospheric evaporation events and coronal rain showers match closely, suggesting a fundamental scale length for heating processes.
• The gas pressure of coronal rain can serve as a proxy for estimating magnetic field strengths in flare loops.
• Coronal rain plays a significant role in the mass and energy cycle of solar flares, making it a valuable diagnostic tool for understanding flare properties.
For full details, see Ref. [1].
References
[2] "Automated spatiotemporal analysis of fibrils and coronal rain using the rolling Hough transform"
