File:Microflare EMT.png: Difference between revisions
Jump to navigation
Jump to search
imported>Schriste (Microflare temperature against emission measure. The correlation plot is the microflares in this study with black plus signs representing the results of a previous RHESSI study ( Battaglia et al. 2005). The dashed straight line rep- resents the correl) |
(Maintenance script uploaded File:Microflare EMT.png) Tag: Server-side upload |
(No difference)
| |
Latest revision as of 14:36, 1 November 2024
Microflare temperature against emission measure. The correlation
plot is the microflares in this study with black plus signs representing the results of a previous RHESSI study ( Battaglia et al. 2005). The dashed straight line rep- resents the correlation found by Feldman et al. (1996b) from GOES and Yohkoh BCS. The numbered curved lines are of constant count rate per detector in 4 Y 8 keV for the thermal model, as a function of temperature and emission measure. The white contour show the events that have a GOES temperature <10 MK. (From Hannah et al. 2008).
File history
Click on a date/time to view the file as it appeared at that time.
| Date/Time | Thumbnail | Dimensions | User | Comment | |
|---|---|---|---|---|---|
| current | 14:36, 1 November 2024 | 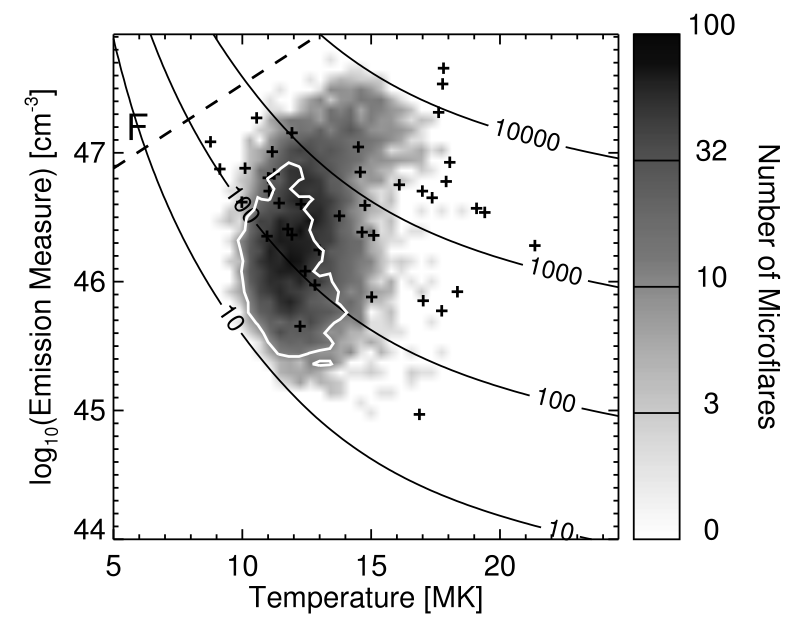 | 799 × 621 (118 KB) | Maintenance script (talk | contribs) | == Summary == Importing file |
You cannot overwrite this file.
File usage
The following page uses this file: