File:XRS fit spectrum 01072007.jpg: Difference between revisions
Jump to navigation
Jump to search
imported>Schriste (MESSENGER XRS spectrum with CHIANTI thermal best-fits. Blue histogram: background-subtracted X-ray count-rate spectrum measured with XRS at the time of peak temperature during the flare starting at 14:30 UT on 1 June 2007. Green and yellow curves: CHIANTI) |
(Maintenance script uploaded File:XRS fit spectrum 01072007.jpg) Tag: Server-side upload |
(No difference)
| |
Latest revision as of 14:34, 1 November 2024
MESSENGER XRS spectrum with CHIANTI thermal best-fits. Blue histogram: background-subtracted X-ray count-rate spectrum measured with XRS at the time of peak temperature during the flare starting at 14:30 UT on 1 June 2007. Green and yellow curves: CHIANTI-predicted line-plus-continuum thermal spectra that when summed (red curve) give the best fit to the data. Purple histogram: pre-flare backgound spectrum.
File history
Click on a date/time to view the file as it appeared at that time.
| Date/Time | Thumbnail | Dimensions | User | Comment | |
|---|---|---|---|---|---|
| current | 14:34, 1 November 2024 | 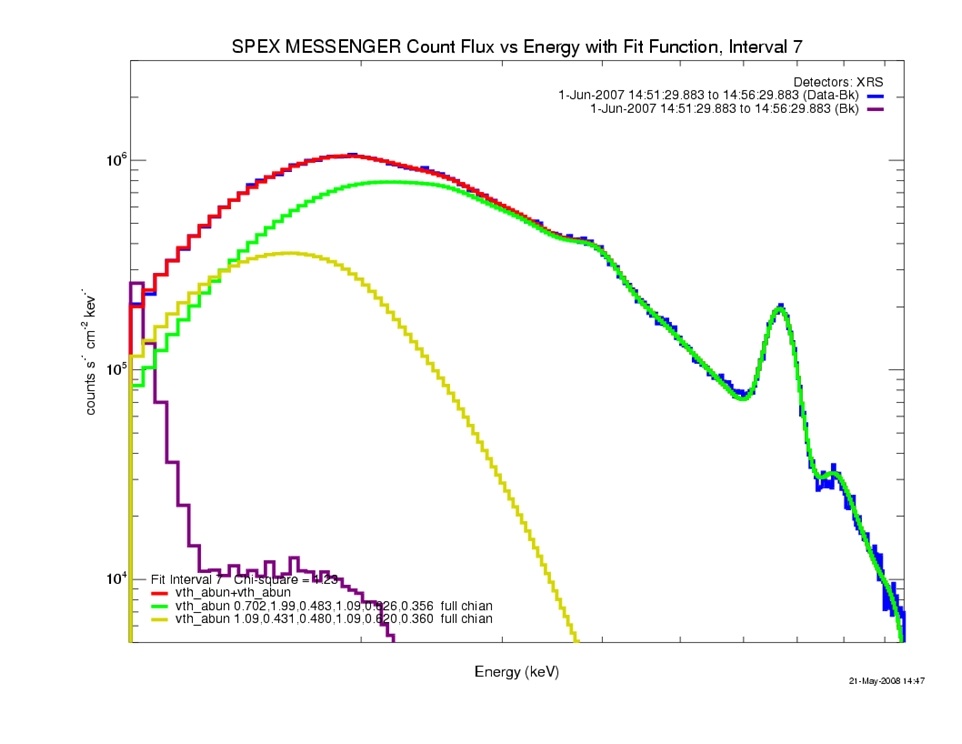 | 962 × 744 (90 KB) | Maintenance script (talk | contribs) | == Summary == Importing file |
You cannot overwrite this file.
File usage
The following page uses this file: