File:182f2.jpg: Difference between revisions
Jump to navigation
Jump to search
imported>Hhudson (Figure 2: Hardness ratio H plotted against the duration T90 for the RHESSI GRBs with the best maximum-likelihood fit of three bivariate lognormal functions. Solid and dashed curves delimit the confidence levels of the fit. The different GRB group members ) |
(Maintenance script uploaded File:182f2.jpg) Tag: Server-side upload |
(No difference)
| |
Latest revision as of 14:35, 1 November 2024
Figure 2: Hardness ratio H plotted against the duration T90 for the RHESSI GRBs with the best maximum-likelihood fit of three bivariate lognormal functions. Solid and dashed curves delimit the confidence levels of the fit. The different GRB group members are denoted with different symbols.
File history
Click on a date/time to view the file as it appeared at that time.
| Date/Time | Thumbnail | Dimensions | User | Comment | |
|---|---|---|---|---|---|
| current | 14:35, 1 November 2024 | 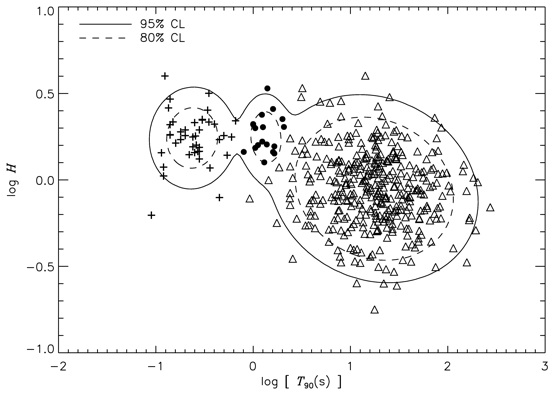 | 554 × 398 (56 KB) | Maintenance script (talk | contribs) | == Summary == Importing file |
You cannot overwrite this file.
File usage
The following page uses this file: