Weekly Report 18Feb2011 25Feb2011: Difference between revisions
imported>Agopie |
imported>Agopie No edit summary |
||
| Line 9: | Line 9: | ||
Time series analysis was done on the 31Dec2007 flare using MESSENGER XRS data. Abundances were measured for various elements over the course of the flare. | Time series analysis was done on the 31Dec2007 flare using MESSENGER XRS data. Abundances were measured for various elements over the course of the flare. | ||
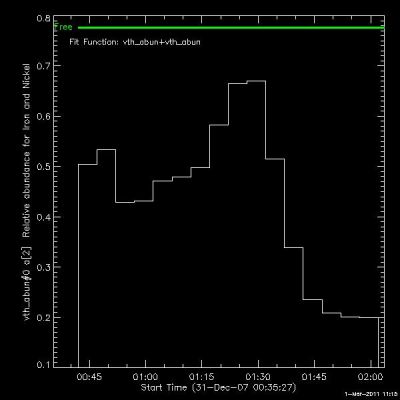
The following shows the Iron-Nickel abundance as a function of time. | |||
[[File:Fe ni abundance.jpg|center|thumb|400px|The Fe-Ni abundance as a function of time for the 31Dec2007 flare(XRS data)]] | [[File:Fe ni abundance.jpg|center|thumb|400px|The Fe-Ni abundance as a function of time for the 31Dec2007 flare(XRS data)]] | ||
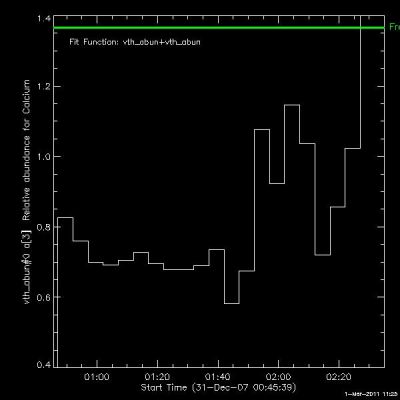
The following shows the Calcium abundance as a function of time. | |||
[[File:Ca abundance.jpg|center|thumb|400px|The Ca abundance as a function of time for the 31Dec2007 flare(XRS data)]] | [[File:Ca abundance.jpg|center|thumb|400px|The Ca abundance as a function of time for the 31Dec2007 flare(XRS data)]] | ||
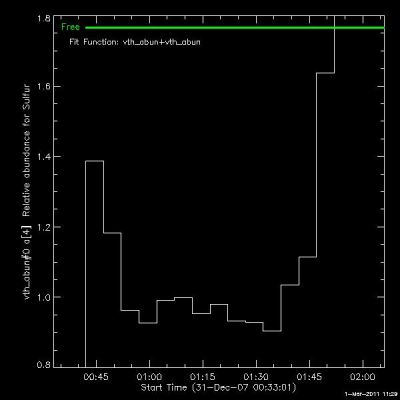
The following shows the Sulfur abundance as a function of time. | |||
[[File:Su abundance.jpg |center|thumb|400px|The Sulfur abundance as a function of time for the 31Dec2007 flare(XRS data)]] | [[File:Su abundance.jpg |center|thumb|400px|The Sulfur abundance as a function of time for the 31Dec2007 flare(XRS data)]] | ||
| Line 18: | Line 21: | ||
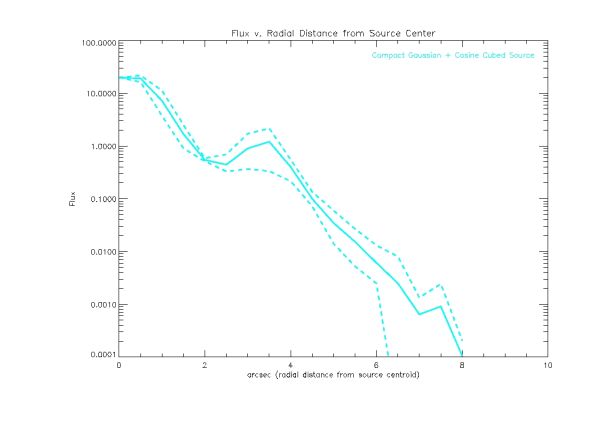
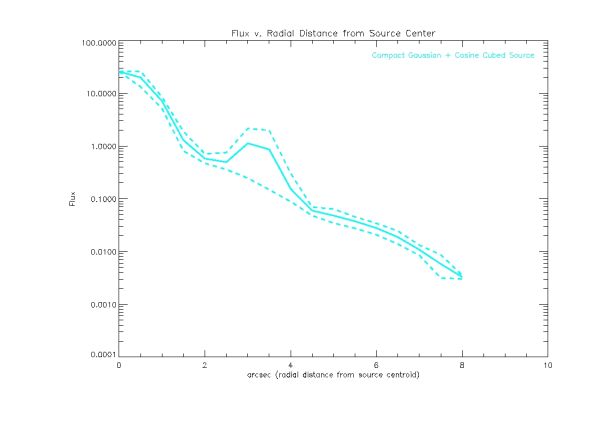
Calibrated eventlist files were created from maps consisting of a compact Gaussian source and an extended cosine cubed source. The total flux of the cosine cubed source was adjusted to different percentages of the total flux of the compact Gaussian source. Pixon and Clean images were made from each eventlist file. Using these images, plots were made of the flux as a function of the radial distance from the peak of the Gaussian source and the cosine cubed source. | Calibrated eventlist files were created from maps consisting of a compact Gaussian source and an extended cosine cubed source. The total flux of the cosine cubed source was adjusted to different percentages of the total flux of the compact Gaussian source. Pixon and Clean images were made from each eventlist file. Using these images, plots were made of the flux as a function of the radial distance from the peak of the Gaussian source and the cosine cubed source. | ||
The following plot shows the flux as a function of radial distance from the peak of Gaussian source and the cosine cubed source. The cosine cubed source is 50% of the total flux in the Gaussian source. | |||
[[File:Gaussian source cosine cubed.jpg|center|thumb|600px|The flux as a function of radial distance from the peak of the compact Gaussian source and cosine cubed source. ]] | [[File:Gaussian source cosine cubed.jpg|center|thumb|600px|The flux as a function of radial distance from the peak of the compact Gaussian source and cosine cubed source. ]] | ||
The following plot shows the flux as a function of radial distance from the peak of Gaussian source and the cosine cubed source. The cosine cubed source is 75% of the total flux in the Gaussian source. | |||
[[File:Gaussian source cosine cubed equal.jpg|center|thumb|600px|The flux as a function of radial distance from the peak of the compact Gaussian source and cosine cubed source.]] | [[File:Gaussian source cosine cubed equal.jpg|center|thumb|600px|The flux as a function of radial distance from the peak of the compact Gaussian source and cosine cubed source.]] | ||
Revision as of 23:20, 1 March 2011
RHESSI Website Migration
The RHESSI Website Migration Project continued.
- Work was done on formatting issues including indentation issues and updating the appearance of links (symbols were added to differentiate external links from internal links).
- Mount points with paths relative to the typo3 installation were added as additional places to upload files and media. I'm still working on adding the mount point for files are outside the path of the typo3 installation.
- All links have been changed to bold typeface.
MESSENGER Data Analysis Project
Time series analysis was done on the 31Dec2007 flare using MESSENGER XRS data. Abundances were measured for various elements over the course of the flare.
The following shows the Iron-Nickel abundance as a function of time.
The following shows the Calcium abundance as a function of time.
The following shows the Sulfur abundance as a function of time.
RHESSI Pixon Albedo Imaging Test
Calibrated eventlist files were created from maps consisting of a compact Gaussian source and an extended cosine cubed source. The total flux of the cosine cubed source was adjusted to different percentages of the total flux of the compact Gaussian source. Pixon and Clean images were made from each eventlist file. Using these images, plots were made of the flux as a function of the radial distance from the peak of the Gaussian source and the cosine cubed source.
The following plot shows the flux as a function of radial distance from the peak of Gaussian source and the cosine cubed source. The cosine cubed source is 50% of the total flux in the Gaussian source.
The following plot shows the flux as a function of radial distance from the peak of Gaussian source and the cosine cubed source. The cosine cubed source is 75% of the total flux in the Gaussian source.
