File:162f2.png: Difference between revisions
Jump to navigation
Jump to search
imported>Hhudson (Left: RHESSI light curves in three energy bands for the flare SOL2005-09-06. Middle: a [http://en.wikipedia.org/wiki/Solar_X-ray_Imager GOES/SXI] image during the rise phase; the contours show RHESSI emission at 8-9 keV with 10% contour levels. Right: RHE) |
imported>TomekMrozek (uploaded a new version of "File:162f2.png") |
(No difference)
| |
Revision as of 18:04, 26 October 2011
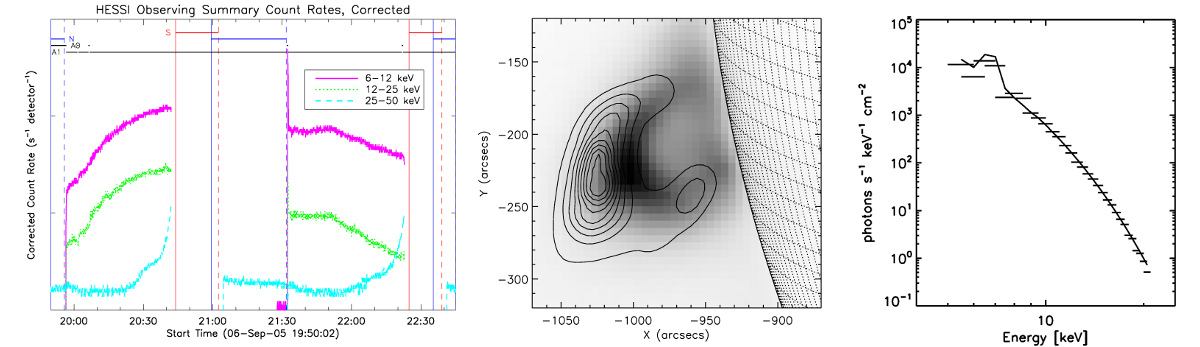
Left: RHESSI light curves in three energy bands for the flare SOL2005-09-06. Middle: a GOES/SXI image during the rise phase; the contours show RHESSI emission at 8-9 keV with 10% contour levels. Right: RHESSI spectrum of the loop-top source at 20:37 UT. Horizontal bars correspond to the energy bin widths. The fit consists of a thermal component and two spectral line complexes (at 6.7 keV and 8.0 keV).
File history
Click on a date/time to view the file as it appeared at that time.
| Date/Time | Thumbnail | Dimensions | User | Comment | |
|---|---|---|---|---|---|
| current | 14:35, 1 November 2024 | 1,200 × 347 (176 KB) | Maintenance script (talk | contribs) | == Summary == Importing file |
You cannot overwrite this file.
File usage
The following page uses this file: