File:99 Overlapping-Cycles.png: Difference between revisions
Jump to navigation
Jump to search
imported>Hhudson (uploaded a new version of "Image:99 Overlapping-Cycles.png": Figure 3: Recent solar minima decomposed using the 'region days' analysis into their old-cycle and new-cycle components. Note that the earlier minima had much more overlap between cycles, an) |
(Maintenance script uploaded File:99 Overlapping-Cycles.png) Tag: Server-side upload |
(No difference)
| |
Latest revision as of 14:33, 1 November 2024
Figure 3. Four panels showing the decomposition of sunspot groups by cycle membership. This is unambiguously determined from their magnetic polarities. The bottom three panels show recent minimum periods; our current minimum (the very bottom) shows that the late arrival of new-cycle spots has allowed the number of old-cycle spots, and hence the total spot coverage, to be remarkably low.
File history
Click on a date/time to view the file as it appeared at that time.
| Date/Time | Thumbnail | Dimensions | User | Comment | |
|---|---|---|---|---|---|
| current | 14:33, 1 November 2024 | 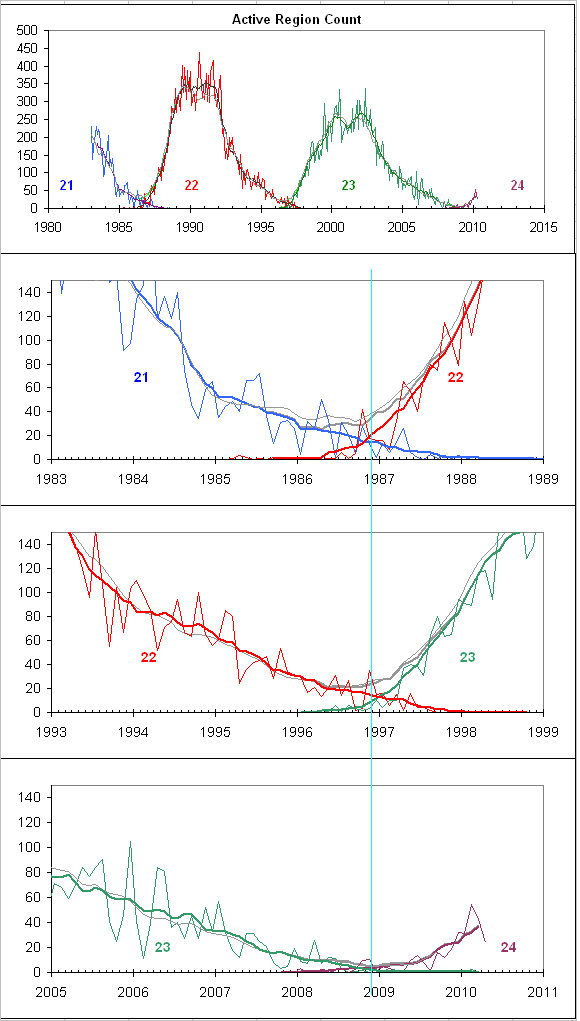 | 580 × 1,021 (42 KB) | Maintenance script (talk | contribs) | == Summary == Importing file |
You cannot overwrite this file.
File usage
The following 2 pages use this file: