File:161fig2.png: Difference between revisions
Jump to navigation
Jump to search
imported>Hhudson (''Upper panel:'' Summed and background subtracted light curve of the solar flare observed by RHESSI on January 1st, 2005. The inset shows the residual emission after subtracting a simple (boxcar) moving average. ''Middle panel:'' Periodogram analysis perf) |
(Maintenance script uploaded File:161fig2.png) Tag: Server-side upload |
(No difference)
| |
Latest revision as of 14:33, 1 November 2024
Upper panel: Summed and background subtracted light curve of the solar flare observed by RHESSI on January 1st, 2005. The inset shows the residual emission after subtracting a simple (boxcar) moving average. Middle panel: Periodogram analysis performed on the residual emission. Lower panel: PSD with best fit broken power-law (solid green line) and the <math>3\sigma</math> significance level (dotted line) indicated. The arrow points to the significant frequency at <math>f \approx 0.244</math> Hz.
File history
Click on a date/time to view the file as it appeared at that time.
| Date/Time | Thumbnail | Dimensions | User | Comment | |
|---|---|---|---|---|---|
| current | 14:33, 1 November 2024 | 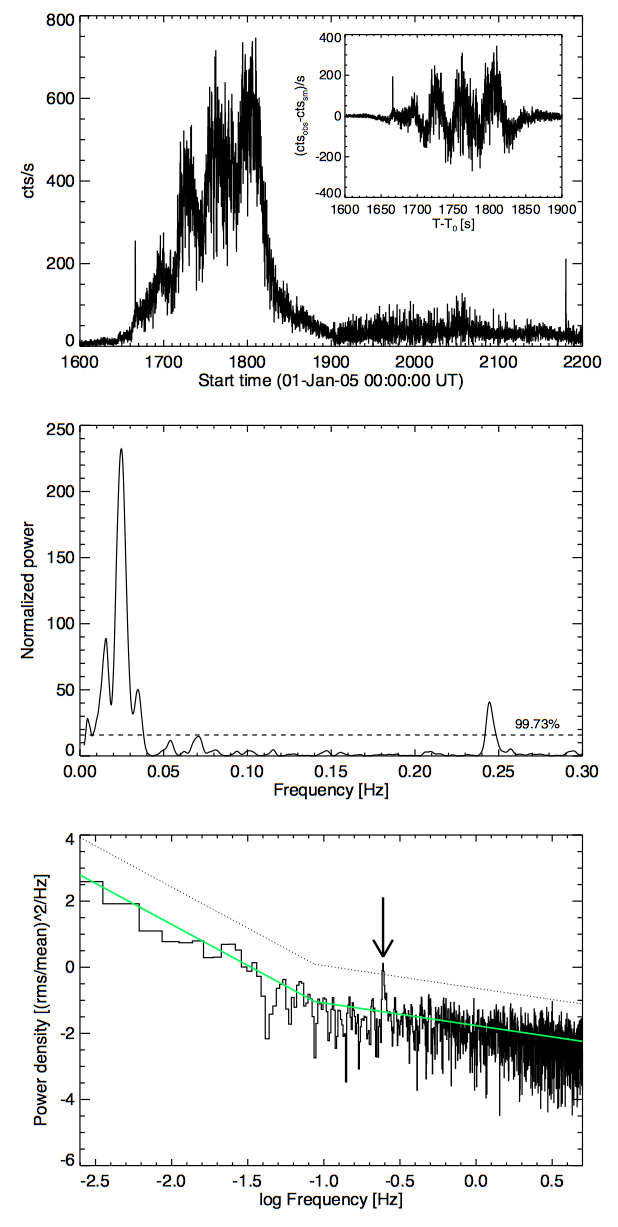 | 618 × 1,227 (138 KB) | Maintenance script (talk | contribs) | == Summary == Importing file |
You cannot overwrite this file.
File usage
The following page uses this file: