Negative Microwave Bursts: Difference between revisions
imported>Hhudson No edit summary |
imported>Hhudson (First draft completed) |
||
| Line 13: | Line 13: | ||
The microwave spectrum, observable by radio observatories, has a close | The microwave spectrum, observable by radio observatories, has a close | ||
relationship with the X-ray spectrum | relationship with the X-ray spectrum. | ||
Typically one sees bursts in both spectral bands, but - rarely - one sees | Typically one sees bursts in both spectral bands, but - rarely - one sees | ||
''negative'' bursts in the microwaves. | ''negative'' bursts in the microwaves. | ||
| Line 33: | Line 33: | ||
== Some examples == | == Some examples == | ||
Negative microwave bursts | Negative microwave bursts sometimes accompany solar flares, but that is not always the case. | ||
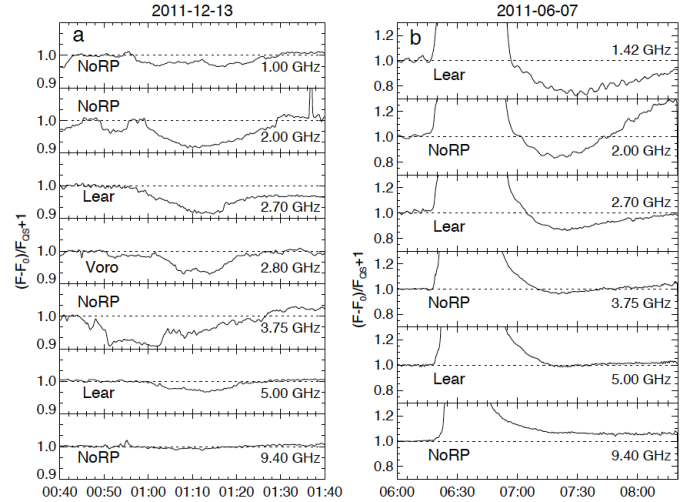
Sometimes coronal activity can result in sudden absorptions in the absence of an obvious flare or CME; we show examples of non-flare (left) and flare (right) negative bursts in Figure 1. | Sometimes coronal activity can result in sudden absorptions in the absence of an obvious flare or CME; we show examples of non-flare (left) and flare (right) negative bursts in Figure 1. | ||
The non-flare case may be an example of a [http://www.ips.gov.au/Educational/2/4/1 "Hyder flare"], as originally described by the remarkable solar physicist | |||
[http://en.wikipedia.org/wiki/Charles_Hyder Charlie Hyder]. | |||
The SDO [http://www.nasa.gov/mission_pages/sunearth/news/News060711-blast.html movies] of the latter make the possible utility of microwave absorption quite obvious! | The SDO [http://www.nasa.gov/mission_pages/sunearth/news/News060711-blast.html movies] of the latter make the possible utility of microwave absorption quite obvious! | ||
In the | In the quiet-Sun case on the left, the dip at long wavelengths at about 01:10 UT corresponds to dimming seen at 304 A, due to the | ||
[http://guide.ceit.metu.edu.tr/thinkquest/hydro-d2.htm He I] | [http://en.wikipedia.org/wiki/Lyman-alpha Lyman-alpha line] of hydrogen-like helium, | ||
The dimming for the flare event may involve this phenomenon, as well as the effects of the CME eruption associated with this very powerful flare. | [http://guide.ceit.metu.edu.tr/thinkquest/hydro-d2.htm He I]. | ||
This clearly implicates relatively cool material embedded in the otherwise hot corona. | |||
The dimming for the major flare event (right panel) may also involve this phenomenon, as well as the effects of the CME eruption associated with this very powerful flare. | |||
[[File:206f1.png|center|700px|thumb|Figure 1: | [[File:206f1.png|center|700px|thumb|Figure 1: | ||
Left, a microwave negative burst not obviously | Left, a microwave negative burst not obviously associated with a flare; right, that observed during the huge event | ||
[http://www.nasa.gov/mission_pages/sunearth/news/News060711-blast.html SOL2011-06-07]. | [http://www.nasa.gov/mission_pages/sunearth/news/News060711-blast.html SOL2011-06-07]. | ||
The movies in this link illustrate how clouds of material move through the corona, often obscuring sources at lower altitude. | The movies in this link illustrate how clouds of material move through the corona, often obscuring sources at lower altitude. | ||
| Line 57: | Line 61: | ||
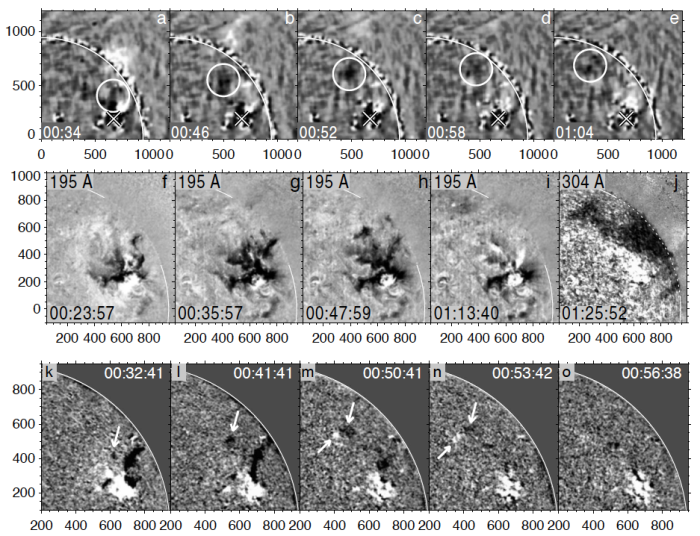
In the event shown in Figure 2, we can see the absorbing cloud in the NoRP microwave observations as it moves across the visible face of the Sun, and we can track it as well with EUV and classical H-alpha observations. | In the event shown in Figure 2, we can see the absorbing cloud in the NoRP microwave observations as it moves across the visible face of the Sun, and we can track it as well with EUV and classical H-alpha observations. | ||
This event resulted in a diminution of about 12% in the 1-3 GHz range, and we have termed it an "anomalous" negative event because of the time development of the absorber. | This event resulted in a diminution of about 12% in the 1-3 GHz range, and we have termed it an "anomalous" negative event because of the time development of the absorber. | ||
We apply the term “anomalous” to an eruption in the sense that instead of a “normal” expansion of an eruptive filament, we see its apparent “disintegration” into myriads of fragments constituting a slowly descending “cloud” | |||
[[File:206f2.png|center|700px|thumb|Figure 2: | [[File:206f2.png|center|700px|thumb|Figure 2: | ||
| Line 63: | Line 68: | ||
== Conclusions == | == Conclusions == | ||
Examples of negative microwave bursts have been known for decades (e.g., Ref. [2]), but now we can exploit the physics involved with far better tools. | |||
These extend into the EUV and X-ray wavelength ranges, but the radio spectrum will always make a unique contribution to deciphering the processes involved. | |||
In the radio domain we now have both imaging and the prospect of imaging spectroscopy, and the examples shown here at fixed frequencies offer only a first taste of what | |||
can be observed. | |||
== Acknowledgements == | == Acknowledgements == | ||
| Line 72: | Line 82: | ||
[1] [http://arxiv.org/abs/1307.6965 "Microwave Negative Bursts as Indications of Reconnection between Eruptive Filaments and Large-Scale Coronal Magnetic Environment"] | [1] [http://arxiv.org/abs/1307.6965 "Microwave Negative Bursts as Indications of Reconnection between Eruptive Filaments and Large-Scale Coronal Magnetic Environment"] | ||
[2] [http://adsabs.harvard.edu/abs/1965sra..book.....K Solar Radio Astronomy] | |||
Revision as of 15:44, 2 September 2013
| Nugget | |
|---|---|
| Number: | 206 |
| 1st Author: | Victor Grechnev |
| 2nd Author: | |
| Published: | August 21, 2013 |
| Next Nugget: | TBD |
| Previous Nugget: | Acceleration-region Densities |
Introduction
The microwave spectrum, observable by radio observatories, has a close relationship with the X-ray spectrum. Typically one sees bursts in both spectral bands, but - rarely - one sees negative bursts in the microwaves. Such bursts were described in the 1950s by the eminent radio astronomer Arthur Covington, who also introduced the much-used F10.7 radio index of solar activity. The negative bursts are in a sense easy to understand - the whole Sun emits microwave radiation from near the base of the corona, and so a relatively cool and absorbing coronal feature - for example, a prominence - may obscure parts of this emission. Indeed, Covington had also used the Moon (via an eclipse observed in Ottawa, in 1946!) as an absorber to show that solar radio emission was concentrated spatially in sunspot regions and to establish the importance of magnetism in solar activity.
The physics of negative microwave bursts may not be simple, and therefore many things may be learned about the behavior of the solar corona by observing it with modern equipment. This includes not only the microwave domain, but also the EUV as currently observed, for example, via the Solar Dynamics Observatory (SDO) among others. We have now begun further studies of these phenomena, as introduced in Ref. [1].
Some examples
Negative microwave bursts sometimes accompany solar flares, but that is not always the case. Sometimes coronal activity can result in sudden absorptions in the absence of an obvious flare or CME; we show examples of non-flare (left) and flare (right) negative bursts in Figure 1. The non-flare case may be an example of a "Hyder flare", as originally described by the remarkable solar physicist Charlie Hyder. The SDO movies of the latter make the possible utility of microwave absorption quite obvious! In the quiet-Sun case on the left, the dip at long wavelengths at about 01:10 UT corresponds to dimming seen at 304 A, due to the Lyman-alpha line of hydrogen-like helium, He I. This clearly implicates relatively cool material embedded in the otherwise hot corona. The dimming for the major flare event (right panel) may also involve this phenomenon, as well as the effects of the CME eruption associated with this very powerful flare.

The radio observatories involved in the observations of Figure 1 are in Australia (Lear), Japan (NoRP), and Russia (Voro), and one can clearly see the wavelength dependence (the free-free opacity increases as the square of the wavelength). One of the most exciting prospects here is that the radio data can be calibrated very precisely, and that there are radio images with much higher spatial resolution than heretofore available. Thus a multi-wavelength analysis of radio, white light, EUV, and X-ray signatures will obviously enrich our knowledge of the physics involved in the negative-burst phenomena.
Multi-Wavelength Observations
In the event shown in Figure 2, we can see the absorbing cloud in the NoRP microwave observations as it moves across the visible face of the Sun, and we can track it as well with EUV and classical H-alpha observations. This event resulted in a diminution of about 12% in the 1-3 GHz range, and we have termed it an "anomalous" negative event because of the time development of the absorber. We apply the term “anomalous” to an eruption in the sense that instead of a “normal” expansion of an eruptive filament, we see its apparent “disintegration” into myriads of fragments constituting a slowly descending “cloud”
Conclusions
Examples of negative microwave bursts have been known for decades (e.g., Ref. [2]), but now we can exploit the physics involved with far better tools. These extend into the EUV and X-ray wavelength ranges, but the radio spectrum will always make a unique contribution to deciphering the processes involved. In the radio domain we now have both imaging and the prospect of imaging spectroscopy, and the examples shown here at fixed frequencies offer only a first taste of what can be observed.
Acknowledgements
This work is based on the research described in Ref. [1], by Irina Kuzmenko, Arkadiy Uralov, Ilya Chertok and the lead author here. Second author Hudson only added links and a bit of history.
