Sun-as-a-star Analysis of the M8.7 Flare on 2022 October 2 Using H-alpha and EUV Spectra Taken by SMART/SDDI and SDO/EVE: Difference between revisions
imported>Hhudson (467 initial upload) |
imported>Hhudson (author's fixes) |
||
| Line 29: | Line 29: | ||
data directly (e.g., Ref [1]). | data directly (e.g., Ref [1]). | ||
In the present study, we perform a Sun-as-a-star analysis of | In the present study, we perform a Sun-as-a-star analysis of | ||
SOL2022- | SOL2022-10-02 (M8.7) using H-alpha and extreme ultraviolet (EUV) | ||
spectra. | spectra. | ||
We believe | We believe this to be the first case of a simultaneous Sun-as-a-star | ||
flare analysis using H-α and EUV spectra. | flare analysis using H-α and EUV spectra. | ||
| Line 67: | Line 67: | ||
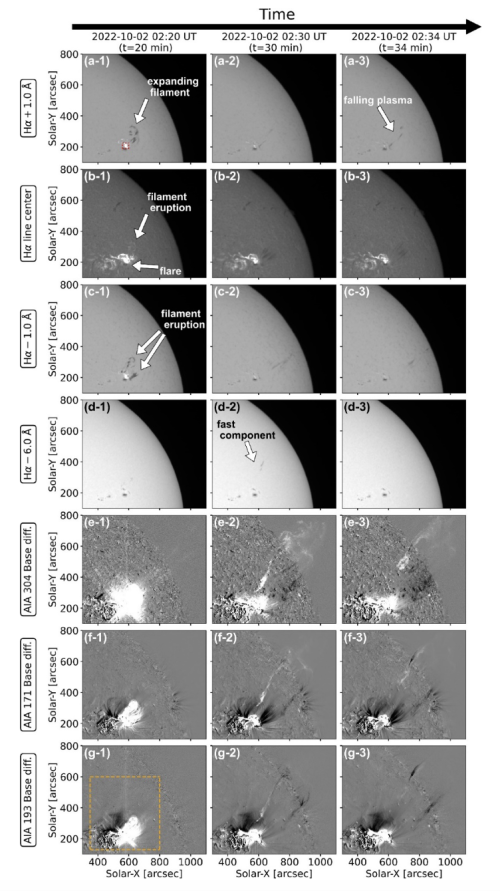
Figure 1 shows the time development of the event. | Figure 1 shows the time development of the event. | ||
Both SDDI and AIA | Both SDDI and AIA produced images of the flare and its associated filament | ||
eruption. | eruption. | ||
In this Nugget we focus on the filament eruption, although the | In this Nugget we focus on the filament eruption, although the | ||
| Line 74: | Line 74: | ||
In the initial phase of the filament eruption, the erupting | In the initial phase of the filament eruption, the erupting | ||
filament is clearly evident in both the Hα and the AIA images | filament is clearly evident in both the Hα and the AIA images | ||
(Figures 1 (a-1)(c-1) and (e-1)(g-1), t=20 minutes). | (Figures 1 (a-1)-(c-1) and (e-1)-(g-1), t=20 minutes). | ||
On the other hand, in the later phase, the erupting filament can be seen in the | On the other hand, in the later phase, the erupting filament can be seen in the | ||
AIA images even though it had become almost invisible in the H&alpha | AIA images even though it had become almost invisible in the Hα | ||
spectral image (Figures 1 (a-2)(d-2) and (e-2)(g-2), t=30 minutes; | spectral image (Figures 1 (a-2)-(d-2) and (e-2)-(g-2), t=30 minutes; | ||
(a-3)(d-3) and (e-3)(g-3), t=34 minutes). | (a-3)-(d-3) and (e-3)-(g-3), t=34 minutes). | ||
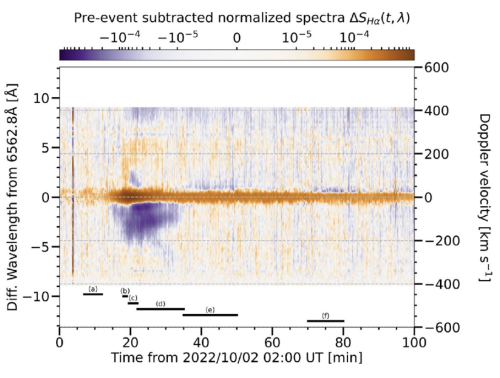
From the SDDI Hα spectra we obtained Sun-as-a-star spectra, | From the SDDI Hα spectra we obtained Sun-as-a-star spectra, | ||
differenced against pre-event spectra, | differenced against pre-event spectra, | ||
| Line 111: | Line 111: | ||
Hα dynamic spectrum, showing the spatially integrated | Hα dynamic spectrum, showing the spatially integrated | ||
Hα spectrum minus a pre-flare spectrum, normalized by | Hα spectrum minus a pre-flare spectrum, normalized by | ||
the full-disk integrated | the full-disk integrated continuum, shown as a two dimensional | ||
color map. | color map. | ||
Positive and negative velocities correspond to redshifted and blueshifted | Positive and negative velocities correspond to redshifted and blueshifted | ||
| Line 137: | Line 137: | ||
the tracking of stellar filament eruptions for a longer time than Hα, | the tracking of stellar filament eruptions for a longer time than Hα, | ||
even in spatially integrated observational data. | even in spatially integrated observational data. | ||
In the full paper (Ref. [2]), we also discuss the prominent <i>redshifted<i> | In the full paper (Ref. [2]), we also discuss the prominent <i>redshifted</i> | ||
EUV component during the decay phase of the flare in the Sun-as-a-star | EUV component during the decay phase of the flare in the Sun-as-a-star | ||
spectra and its connection to post-flare loops. | spectra and its connection to post-flare loops. | ||
Revision as of 11:54, 18 April 2024
| Nugget | |
|---|---|
| Number: | 467 |
| 1st Author: | Takato OTSU |
| 2nd Author: | |
| Published: | February 13, 2024 |
| Next Nugget: | TBD |
| Previous Nugget: | When it rippled in one place and exploded in another |
Introduction
Similar to solar flares, stellar flares appear as sudden brightening of remote stars. Some stellar flares emit energies of more than 1033 erg (superflares) and accurate estimation of their impact on exoplanets is essential for investigating the habitability. Recent stellar observations have reported various signatures associated with stellar flares, suggesting that stellar flares are accompanied by various familiar solar-like activities such as filament/prominence eruptions. It is, however, difficult to identify what occurs on stellar surfaces because they cannot be resolved with the current observational instruments. To understand stellar data, some studies have utilized solar data by performing Sun-as-a-star analyses in which solar data is spatially integrated to be compared with stellar data directly (e.g., Ref [1]). In the present study, we perform a Sun-as-a-star analysis of SOL2022-10-02 (M8.7) using H-alpha and extreme ultraviolet (EUV) spectra. We believe this to be the first case of a simultaneous Sun-as-a-star flare analysis using H-α and EUV spectra.
Observations and Methods
We used two instruments for the Sun-as-a-star analysis. For H-α spectroscopy we used the Solar Dynamics Doppler Imager (SDDI) at the Solar Magnetic Activity Research Telescope (SMART) of Hida Observatory (Kyoto University). For EUV spectra we used the Extreme ultraviolet Variability Experiment (EVE) on board the Solar Dynamics Observatory (SDO), and for EUV imaging, the Atmospheric Imaging Assembly (AIA) also on board the SDO. We could thus study the dynamics of our flare and its eruption both H-α and EUV wavelengths.

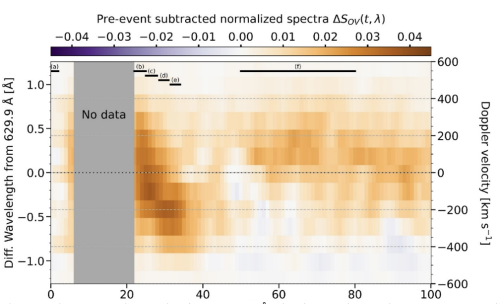
Figure 1 shows the time development of the event. Both SDDI and AIA produced images of the flare and its associated filament eruption. In this Nugget we focus on the filament eruption, although the flare involved various other kinds of activity (see Ref. [2] for details). In the initial phase of the filament eruption, the erupting filament is clearly evident in both the Hα and the AIA images (Figures 1 (a-1)-(c-1) and (e-1)-(g-1), t=20 minutes). On the other hand, in the later phase, the erupting filament can be seen in the AIA images even though it had become almost invisible in the Hα spectral image (Figures 1 (a-2)-(d-2) and (e-2)-(g-2), t=30 minutes; (a-3)-(d-3) and (e-3)-(g-3), t=34 minutes). From the SDDI Hα spectra we obtained Sun-as-a-star spectra, differenced against pre-event spectra, by spatial integration including the target flare (as in Ref. [1]). We similarly obtained differenced Sun-as-a-star EUV spectra from EVE, noting that these observations are full-disk. We focus on the O v 629.7 Å line observed by EVE.
Results & Implications for stellar observations
The Sun-as-a-star Hα spectra showed blueshifted absorption corresponding to the filament eruption, as well as emission near the line center coming from the flare (Figure 2). Furthermore, the O v 629.7 Å spectra showed blueshifted brightening, which can also be attributed to the filament motion (Figure 3). Even when the blueshifted absorption became almost invisible in the Hα spectra, the O v blueshifted brightening up to 400 km/s was still clearly visible. This behavior of the blueshifted Hα absorption and blueshifted O v emission is consistent with the change of visibility of the filament eruption confirmed in the spatially resolved images taken by the both SDDI and AIA (Figure 1). Our Sun-as-a-star results indicate even when the shifted components which are expected to originate from stellar eruptions become almost invisible in the spatially integrated stellar Hα spectra, the erupting materials may still be present and observable in EUV spectra.

Conclusions
We conducted a Sun-as-a-star analysis of an M8.7 solar flare and the associated filament eruption (SOL2022-10-03) using Hα spectral images and full-disk-integrated EUV spectra observed by SMART/SDDI and SDO/ EVE, respectively. Our data showing filament eruption suggest that EUV spectra can enable the tracking of stellar filament eruptions for a longer time than Hα, even in spatially integrated observational data. In the full paper (Ref. [2]), we also discuss the prominent redshifted EUV component during the decay phase of the flare in the Sun-as-a-star spectra and its connection to post-flare loops.
References
[1] "Sun-as-a-star Analyses of Various Solar Active Events Using Hα Spectral Images Taken by SMART/SDDI"
