The Power of Turbulence: Difference between revisions
imported>Hhudson No edit summary |
imported>Hhudson (author's version) |
||
| Line 11: | Line 11: | ||
=== Introduction === | === Introduction === | ||
Observations of solar flares, the largest astrophysical explosions in our solar system, lend considerable support to a scenario in which a significant fraction of the magnetic energy is converted into the acceleration of non-thermal electrons. | |||
About a year before the first hard X-ray observation of the sun, E. Parker and D. Tidman at the Fermi Institute for Nuclear Studies in Chicago conjectured that the production of suprathermal particles is the result of a surge of turbulence through a process now well-known as “Fermi acceleration” (Ref. [1]). | |||
The logic behind this conjecture is straightforward: reconnection of the magnetic field needs flows, the Reynolds number in the solar corona is large, flows at large Reynolds numbers are turbulent and hence, particle acceleration is turbulent! | |||
In this RHESSI nugget we present observational evidence that solar flares do indeed involve turbulence, and that the location and timing of this turbulence is consistent with the idea that stochastic Fermi acceleration is the process responsible for the generation of suprathermal particles. | |||
In this | |||
=== Location of turbulence and magnetic reconnection === | |||
fleet of wonderful telescopes in space and on the ground. | |||
We have used data from RHESSI, as well as from | A well-studied flare (SOL2013-05-13) was observed, as is typical now, by a whole fleet of wonderful telescopes in space and on the ground. | ||
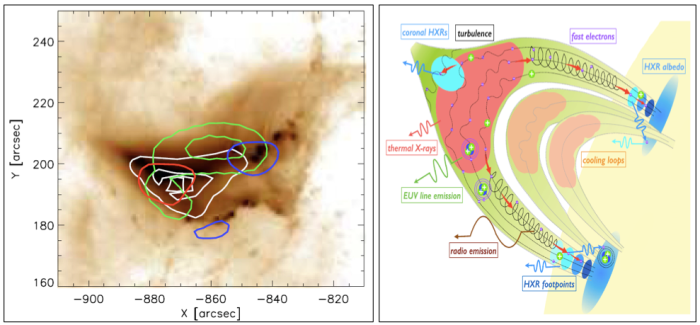
[AIA], | We have used data from RHESSI, as well as from [AIA], [HMI], [Hinode/EIS]. and the [Nobeyama Solar Observatory]. Figure 1 shows the multiwavelength morphology of the flare along with a cartoon summarizing the different flare components. | ||
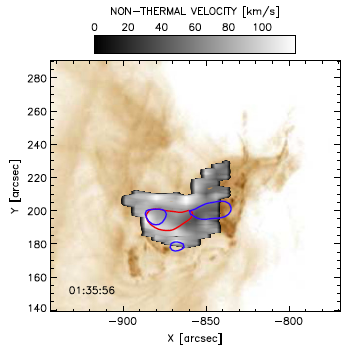
[HMI], | A snapshot of the turbulent component is shown in Figure 2, based on the analysis of the Fe XXIV 255 Å line profile which reveals a plasma at temperatures 10-15 MK (million Kelvin). | ||
[Hinode/EIS]. | The line shape on each pixel in the grey shaded area in the image is close to a | ||
and the | |||
[Nobeyama Solar Observatory]. | |||
Figure 1 shows the multiwavelength morphology of the flare | |||
along with a cartoon summarizing the different flare components. | |||
A snapshot of the turbulent component is shown in Figure 2 | |||
based on the analysis of the Fe XXIV 255 Å line profile which | |||
reveals a plasma at | |||
The line shape on each pixel in the grey | |||
[Gaussian] | [Gaussian] | ||
but the width of the Gaussian is larger than expected from the | but the width of the Gaussian is larger than expected from the | ||
[Doppler] | [Doppler] | ||
signature of ion thermal motions at the | signature of ion thermal motions at the temperature where the line is formed. | ||
Such "non-thermal broadening" of spectral lines reveals random bulk motion of the emitting ions, i.e., turbulence. | |||
bulk motion of the emitting ions, | Given also that the magnetic field lines are frozen-in to the ion flows, we conjecture that the grey area in Figure 2 is also the location where both turbulence and magnetic reconnection occur. | ||
Given that the magnetic field lines are frozen-in the ion | |||
conjecture that the grey area in Figure 2 is the location where both | |||
turbulence and magnetic reconnection occur | |||
[[File:308f1.png|700px|thumb|center|Figure 1: | [[File:308f1.png|700px|thumb|center|Figure 1: | ||
| Line 74: | Line 54: | ||
=== Energetics and timing === | === Energetics and timing === | ||
We now focus on the energetics and the timing of the event | We now focus on the energetics and the timing of the event. | ||
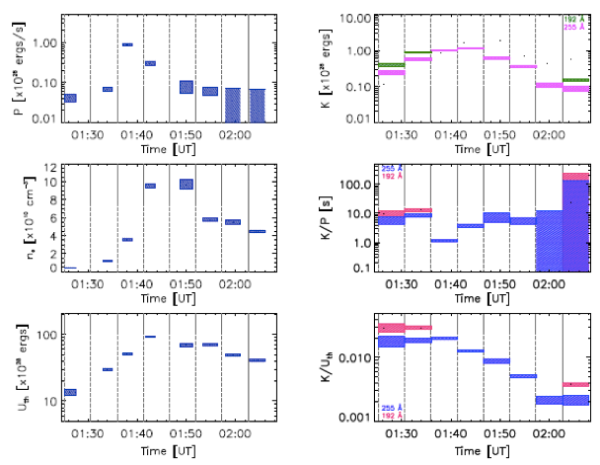
In Figure 3 we plot the ratio K/P between the kinetic energy K in the turbulent flows (obtained from the EIS line-broadening observations) and the input power P (from RHESSI hard X-ray observations). | |||
This ratio has the units of time and Figure 3 shows that it maintains a relatively constant value in the range 1-10 s. | |||
Figure 3 | Interestingly, this time scale turns out to be close to the Alfvén time, the time it takes [Alfvén waves] to transit the observed length (~10,000 km) of the flare loops at the Alfvén speed, which we estimate at 1000 km/s from a magnetic field of 300 G and density 10<sup>11</sup> cm<sup>-3</sup>. | ||
kinetic energy K (from EIS) and the input power P (from RHESSI). | The turbulent kinetic energy K always remains quite small in comparison with both the thermal energy and the estimated magnetic energy. | ||
This ratio has units of time and Figure 3 | But taking the relatively short Alfvén time to be the dissipation time of the turbulence, the rate of conversion of energy from magnetic energy to turbulence, and from turbulence to nonthermal particles, rivals the power in non-thermal electrons. | ||
maintains a relatively constant value in the range 1-10 s. | Thus, the power associated with the creation and dissipation of turbulence (a quantity seldom previously estimated) may rival that of other major components of the released energy in solar flares (see, e.g., Ref. [2]). | ||
it takes | |||
[ | |||
at the | |||
a magnetic field of 300 G | |||
small | |||
and | |||
But | |||
electrons. | |||
Thus | |||
previously estimated | |||
released energy in solar flares (see, e.g., Ref. [ | |||
[[File:308f3.png|600px|thumb|center|Figure 3: | [[File:308f3.png|600px|thumb|center|Figure 3: | ||
| Line 114: | Line 77: | ||
This reservoir can also be identified with a possible region of magnetic | This reservoir can also be identified with a possible region of magnetic | ||
reconnection, necessary for the magnetic restructuring in the flare. | reconnection, necessary for the magnetic restructuring in the flare. | ||
The analysis (Ref. [ | The analysis (Ref. [3]) supports the idea that the turbulence acts as a | ||
reservoir, mediating the transfer of energy from reconnecting magnetic fields | reservoir, mediating the transfer of energy from reconnecting magnetic fields | ||
to accelerated particles in solar flares and presumably in other astrophysical | to accelerated particles in solar flares and presumably in other astrophysical | ||
| Line 121: | Line 84: | ||
=== References === | === References === | ||
[1] [ | [1] [1958PhRv..111.1206P "Suprathermal Particles"] | ||
[2] [http://adsabs.harvard.edu/abs/2012ApJ...759...71E "Global Energetics of Thirty-eight Large Solar Eruptive Events"] | [2] [http://adsabs.harvard.edu/abs/2012ApJ...759...71E "Global Energetics of Thirty-eight Large Solar Eruptive Events"] | ||
[3] [http://adsabs.harvard.edu/abs/2017PhRvL.118o5101K "Turbulent Kinetic Energy in the Energy Balance of a Solar Flare"] | |||
Revision as of 15:47, 23 September 2017
| Nugget | |
|---|---|
| Number: | 308 |
| 1st Author: | Nic Bian |
| 2nd Author: | |
| Published: | 25 September 2017 |
| Next Nugget: | NuSTAR |
| Previous Nugget: | The Kelvin Force |
Introduction
Observations of solar flares, the largest astrophysical explosions in our solar system, lend considerable support to a scenario in which a significant fraction of the magnetic energy is converted into the acceleration of non-thermal electrons. About a year before the first hard X-ray observation of the sun, E. Parker and D. Tidman at the Fermi Institute for Nuclear Studies in Chicago conjectured that the production of suprathermal particles is the result of a surge of turbulence through a process now well-known as “Fermi acceleration” (Ref. [1]). The logic behind this conjecture is straightforward: reconnection of the magnetic field needs flows, the Reynolds number in the solar corona is large, flows at large Reynolds numbers are turbulent and hence, particle acceleration is turbulent! In this RHESSI nugget we present observational evidence that solar flares do indeed involve turbulence, and that the location and timing of this turbulence is consistent with the idea that stochastic Fermi acceleration is the process responsible for the generation of suprathermal particles.
Location of turbulence and magnetic reconnection
A well-studied flare (SOL2013-05-13) was observed, as is typical now, by a whole fleet of wonderful telescopes in space and on the ground. We have used data from RHESSI, as well as from [AIA], [HMI], [Hinode/EIS]. and the [Nobeyama Solar Observatory]. Figure 1 shows the multiwavelength morphology of the flare along with a cartoon summarizing the different flare components. A snapshot of the turbulent component is shown in Figure 2, based on the analysis of the Fe XXIV 255 Å line profile which reveals a plasma at temperatures 10-15 MK (million Kelvin). The line shape on each pixel in the grey shaded area in the image is close to a [Gaussian] but the width of the Gaussian is larger than expected from the [Doppler] signature of ion thermal motions at the temperature where the line is formed. Such "non-thermal broadening" of spectral lines reveals random bulk motion of the emitting ions, i.e., turbulence. Given also that the magnetic field lines are frozen-in to the ion flows, we conjecture that the grey area in Figure 2 is also the location where both turbulence and magnetic reconnection occur.


Energetics and timing
We now focus on the energetics and the timing of the event. In Figure 3 we plot the ratio K/P between the kinetic energy K in the turbulent flows (obtained from the EIS line-broadening observations) and the input power P (from RHESSI hard X-ray observations). This ratio has the units of time and Figure 3 shows that it maintains a relatively constant value in the range 1-10 s. Interestingly, this time scale turns out to be close to the Alfvén time, the time it takes [Alfvén waves] to transit the observed length (~10,000 km) of the flare loops at the Alfvén speed, which we estimate at 1000 km/s from a magnetic field of 300 G and density 1011 cm-3. The turbulent kinetic energy K always remains quite small in comparison with both the thermal energy and the estimated magnetic energy. But taking the relatively short Alfvén time to be the dissipation time of the turbulence, the rate of conversion of energy from magnetic energy to turbulence, and from turbulence to nonthermal particles, rivals the power in non-thermal electrons. Thus, the power associated with the creation and dissipation of turbulence (a quantity seldom previously estimated) may rival that of other major components of the released energy in solar flares (see, e.g., Ref. [2]).
Conclusion
In summary, the observations presented here demonstrate the presence of a significant energy reservoir in turbulent motions, which correlates well in space and time with the observed production of non-thermal electrons. This reservoir can also be identified with a possible region of magnetic reconnection, necessary for the magnetic restructuring in the flare. The analysis (Ref. [3]) supports the idea that the turbulence acts as a reservoir, mediating the transfer of energy from reconnecting magnetic fields to accelerated particles in solar flares and presumably in other astrophysical acceleration sites as well.
References
[1] [1958PhRv..111.1206P "Suprathermal Particles"]
[2] "Global Energetics of Thirty-eight Large Solar Eruptive Events"
[3] "Turbulent Kinetic Energy in the Energy Balance of a Solar Flare"
