Weekly Report 18Mar2011
RHESSI Albedo Imaging Test
For the following test a circular Gaussian map was created with increasing standard deviations. From each of these maps a calibrated eventlist file was created. From these eventlist files Clean images were created. The Clean images were created with the following parameters:
- Detectors: 1 to 9
- Energy: 15 keV to 25 keV
- Time: 20-Feb-2002 11:09:10 - 11:09:40
- Clean Beam Width: Varied from 1, 1.5, 2
For the original set of runs the 50% contour of the image was calculated and the standard deviation in the X and Y direction was calculated. This was then plotted as a function of the standard deviation of the original lap. There were problems with this approach, as the standard deviation of the map increased the Clean image broke up. This broke up the 50% contour so the standard deviation of the contour including the pixel with the maximum value of the flux were smaller than would be expected.
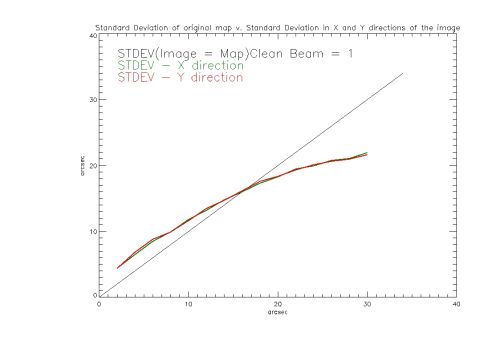
Due to this a new method was tried, with the standard deviation of the Clean image taken for the entire image instead of the 50% contour. The plot below shows the standard deviation in the X(Green) and Y(Red) direction as a function of the standard deviation of the original circular Gaussian Map. The images were made with a clean beam width factor of 1.
The standard deviation of the entire image in the X and Y direction is plotted above versus the standard deviation of the original map. At lower standard deviations of the map the Clean image shows larger standard deviations in the X and Y directions. As the
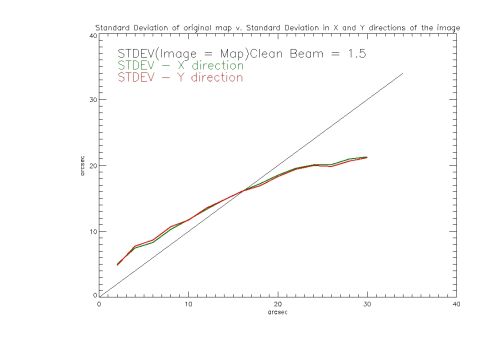
The plot below shows the standard deviation in the X(Green) and Y(Red) direction as a function of the standard deviation of the original circular Gaussian Map. The images were made with a clean beam width factor of 1.5 .
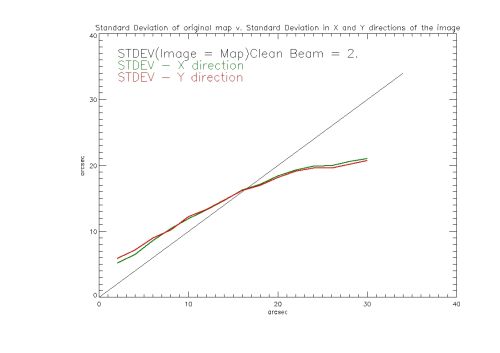
The plot below shows the standard deviation in the X(Green) and Y(Red) direction as a function of the standard deviation of the original circular Gaussian Map. The images were made with a clean beam width factor of 2.


