Weekly Report 25Mar2011
Jump to navigation
Jump to search
RHESSI Albedo Imaging Test
The RHESSI Albedo Imaging test continued.
The following steps were attempted with Pixon:
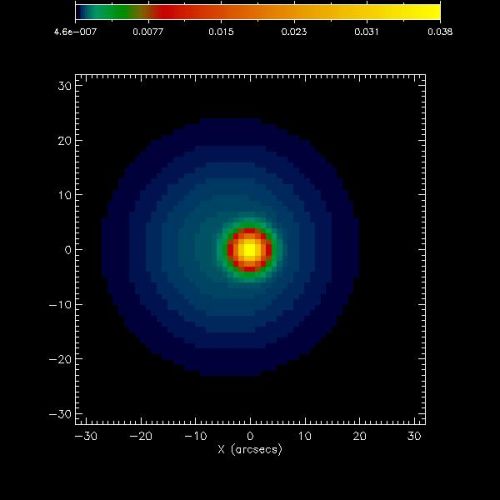
- Pixon images were made from maps that contained two circular Gaussian sources.
- The sources were centered at locations 4 arcsecs apart.
- One source was compact (standard deviation of 2 arcsecs) while the other was extended.
- Pixon images were made with three detector combinations 1-9, 1-4, and 4-9.
The table below shows the detector combinations
| Original Map Configuration | Imaging Algorithm | Detectors Used | Image Centroid X | Image Centroid Y | ST DEV X | ST DEV Y | |
| Two Circular Gaussian Sources (offset by 4 arcsec) | Pixon | 1 to 9 | 907.47 | 256.34 | 9.64 | 9.64 | |
| Two Circular Gaussian Sources (offset by 4 arcsec) | Pixon | 4 to 9 | 907.21 | 256.18 | 9.38 | 9.56 | |
| Two Circular Gaussian Sources (offset by 4 arcsec) | Pixon | 1 to 4 | 910.37 | 255.26 | 2.27 | 2.12 | |
| Two Circular Gaussian Sources (offset by 4 arcsec) | Clean | 1 to 9 | 907.59 | 256.18 | 8.98 | 9.02 | |
| Two Circular Gaussian Sources (offset by 4 arcsec) | Clean | 1 to 4 | 910.87 | 255.92 | 5.97 | 5.82 | |
| Two Circular Gaussian Sources (offset by 4 arcsec) | Clean | 4 to 9 | 907.83 | 256.21 | 9.75 | 9.83 |

The plot shows the flux profiles of images made with Pixon from a map with two offset Gaussian sources, one with a standard deviation of two arcsecs and one with a standard deviation of 10 arcsec. The seperation of the two sources is 4 arcsecs. The plots were made from images using detectors 1 to 9, detectors 1 to 4, and detectors 4 to 9.
