File:Loop shrink.png
Loop_shrink.png (447 × 363 pixels, file size: 46 KB, MIME type: image/png)
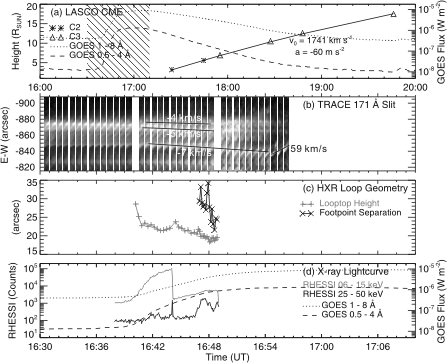
Coronal implosion observed in EUV and X-rays. a) Slices of TRACE 171 Å images cut by the horizontal slit as defined in Figure File:hxr_motion.png are rotated to a vertical direction and placed on the time axis. The slice width on the time axis reflects the exposure duration of each image and voids are due to data gaps. b) Time evolution of the height of the HXR looptop emission (in a '+' symbol) as well as the separation between two conjugate HXR footpoints (in an 'x' symbol). c) RHESSI count rates (s-1) in the 6 - 15 keV (grey) and 25 - 50 keV (black) energy range (scaled by the y-axis on the left), and GOES 1 - 8 Å (0.5 - 4 Å) fluxes in dotted (dashed) line (scaled by the y-axis on the right). Note that the sudden transition in the 6 - 15 keV lightcurve was due to the change of the RHESSI attenuator state from A0 to A1 at 16:44:08 UT, and that the RHESSI observation was discontinued at 16:49:28 UT when RHESSI went into eclipse.
File history
Click on a date/time to view the file as it appeared at that time.
| Date/Time | Thumbnail | Dimensions | User | Comment | |
|---|---|---|---|---|---|
| current | 14:33, 1 November 2024 | | 447 × 363 (46 KB) | Maintenance script (talk | contribs) | == Summary == Importing file |
You cannot overwrite this file.
File usage
The following page uses this file: