Parameterized Flare Models with Chromospheric Compressions
A new approach to modeling the lower flare atmosphere
| Nugget | |
|---|---|
| Number: | 315 |
| 1st Author: | Adam F. Kowalski |
| 2nd Author: | Joel C. Allred |
| Published: | 17 January 2018 |
| Next Nugget: | Joint MinXSS and RHESSI Flare X-ray Spectra between 1 and 15 keV, MinXSS and RHESSI measure flare spectra over 1-15 keV |
| Previous Nugget: | A Curious Sunspot Group in 2018 |
Radiative-hydrodynamic (RHD) simulations in 1D have shown that high energy deposition rates from electron beams produce two flaring regions at T~104 K that develop in the chromosphere: a cooling “condensation” (downflowing compression) and heated non-moving (stationary) flare layers just below the condensation. The
high beam flux simulations are computationally expensive in 1D, and the (human) timescales for completing flare models with adaptive grids in 3D will likely be unwieldy for some time to come. We have developed a prescription for predicting the evolved states and emergent near-UV and optical continuum spectral properties of RHD model flare atmospheres based on an atmospheric reference parameter at early times in the simulations.
This reference parameter is the column mass in the lower atmosphere where the flare temperature increases above T~10,000 K and hydrogen becomes nearly completely ionized. The reference column mass, or mref, determines the amount of the lower atmosphere that is compressed into the chromospheric condensation in evolved states in the RHD simulations. In these evolved states, the condensation has cooled to T~10,000 K and has descended to the height of the top of the T~10,000 K stationary flare layers. We have made a (publicly available) Python GUI that allows one to vary mref through a large possible range and calculates the emergent LTE near-UV and optical continuum radiation properties of the parameterized evolved states. The interesting parameter space can then be investigated more thoroughly with time-dependent, non-LTE models. Our parameterization has been tested over a large range of electron beam energy deposition rates (1011 to 1013 erg cm-2 s-1) and can be easily adapted for other flare-heating scenarios that produce two flare layers at pre-flare chromospheric heights. The details of this parameterization have been published in Kowalski & Allred 2018 ApJ 852, 61.
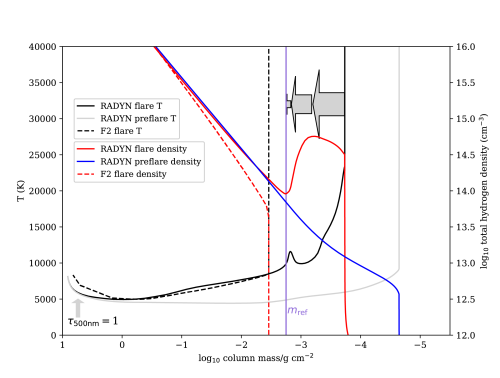
Our tool can be used for a new generation of semi-empirical flare modeling that includes density stratifications of chromospheric condensations parameterized by mref. Figure 1 demonstrates why static, semi-empirical flare models (and semi-empirical models that invoke an ad-hoc velocity field) need to be improved with more realistic modeling. Figure 1 shows the temperature and density profiles of a widely-used hydrostatic, semi-empirical flare model (“F2”) from Machado et al. 1980 (ApJ 242, 336) compared to an evolved state of an RHD flare model atmosphere (the “5F11” electron beam heating model calculated with the RADYN code) from Kowalski et al. 2017 ApJ 836, 12. In the F2 model, the flare transition region (where T exceeds 40,000 K in these figures) is located at a higher column mass (and lower height) than the transition region in their non-flaring model atmosphere, thus giving brighter emission lines in the flare. In the RHD model, the flare transition region is located at a larger column mass and lower height than in the pre-flare state as well. However, the RHD model includes the compression of the atmosphere (i.e., the chromospheric condensation) just below the flare transition region, as indicated by the factor of ~ten increase in hydrogen density. The compression is due to the large pressure gradient (spike) in the flare transition region, which drives material toward the photosphere -- the magnitudes of downward gas speeds in the chromospheric condensation are indicated by the relative vertical sizes of the grey arrows. By conservation of mass, a velocity gradient in an atmosphere causes mass to pile up in certain locations. Static semi-empirical models like F2 do not include the increase in gas density below the flare transition region and thus the chromospheric flare opacities are not consistent with a deeper flare transition region. The value of log10 mref = -2.75 for the RADYN model in Figure 1 is indicated with a purple vertical line, which occurs where downflowing material of the chromospheric condensation meets the top of the stationary flare layers.
