RHESSI Imaging on Short Timescales
Introduction
Very little has been done to investigate RHESSI imaging capabilities on short time scales, even as long as the spacecraft rotation period of 4 s. I have begun to investigate this issue by looking at the decay of the 21 April 2002 event during the second orbit after 02:00 UT, when we can safely assume that the morphology of the flare is not changing significantly on such short time scales. Furthermore, the emission is primarily at energies below 20 keV and the source(s) are quite extended so there is little, if any, modulation by the finer grids.
Images in 4-second Time Intervals
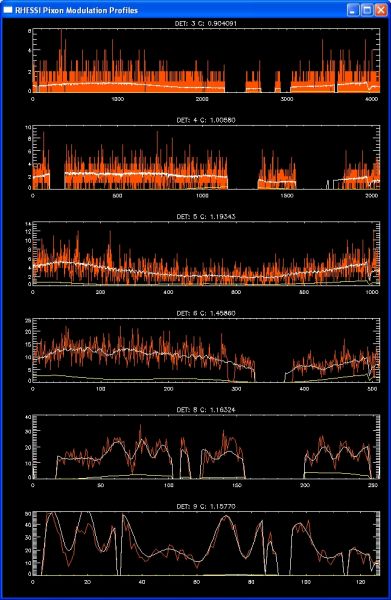
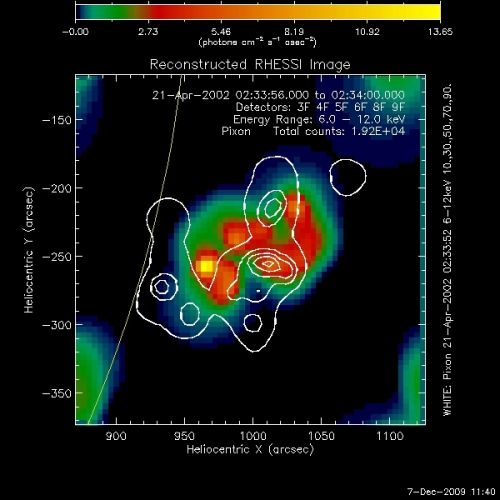
Despite this belief that the source(s) will be extended, the pixon image for a random 4-s interval during this orbit shows several structures.
- Pixon Image Analysis for 4-s Interval
Note that despite the relatively small values of the C-statistic for all detectors, there are considerable differences between the measured count rates and the rates calculated from the image, especially for detector 9.
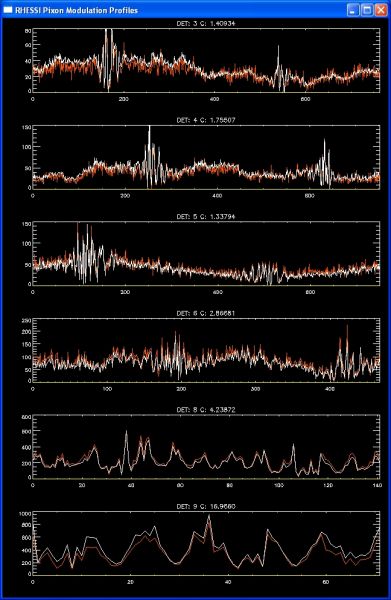
The pixon image for the next 4-s interval looks nothing like the first as shown in the next figure, where this second image is shown in color with the contours showing the first image.
- Pixon Image Analysis for Next 4-s Interval
The pixon modulation profiles for this second 4-s interval look similar but note the several large data gaps for detector 8 and 9 and the significantly larger values of the C-statistic, with a value for detector 8 of 2.4. Also note that the predicted profile (the white curve) for detector 8 is shown during a data gap. It is unknown at this time why that happens since pixon should not be using any data during data gaps.
Source Location vs. Time Every 4 s
The location of the back-projection source determined for individual grids is shown as a function of time in the next figure.
Images in 20-second Time Intervals
- Pixon image for 20 s interval


