Awesome Stellar Flare Spectra
| Nugget | |
|---|---|
| Number: | 128 |
| 1st Author: | Adam Kowalski |
| 2nd Author: | Suzanne Hawley |
| Published: | 2010 June1 |
| Next Nugget: | TBD |
| Previous Nugget: | RHESSI's Anneal Adventure |
Introduction
RHESSI observations have abundantly confirmed the close association of hard X-rays with white-light flare emission. But what is the emission mechanism? In principle we could unlimber high-resolution spectrographs and learn a great deal, but for somewhat unclear reasons solar astronomers have pretty much failed to do this and still refer to Hodgson's description of the first-observed solar flare as having "the dazzling brilliancy of the bright star α Lyrae."
So... in the absence of much direct spectroscopic evidence, we need to turn to stellar flares for guidance. One problem on the Sun is to get the spectrograph slit situated on the right part of the Sun at the right time. With stars, there is no problem about "where", just "when", but many flare stars are much more active than the Sun and also produce more powerful flares. We can use these spectra for guidance on the physics of solar flares, with of course the hypothesis that the solar and stellar flare events are fundamentally similar. We report here a "Megaflare" example (reference [1]) from the well-known dMe star YZCMi.
The stellar flare
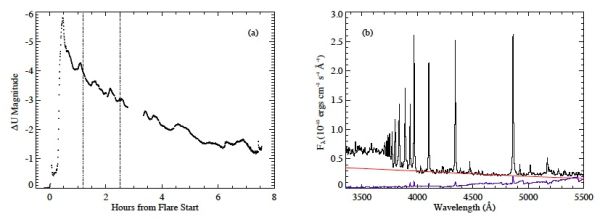
We do not call this a "megaflare" for no reason - Figure 1 (a) shows the light curve, which reveals a colossal brightening of almost six magnitudes in the U band. This corresponds to a brightness increase for the whole star of more than a factor of 100; for comparison (see the previous Nugget) the most powerful solar flare does not appear to increase the solar luminosity by more than about 0.1%. The total flare energy in the U band was more than 1034 erg, more powerful than the most violent solar flare. The light curve shows a typical fast-rise/slow-decay pattern, and a duration of many hours. During this time many high-resolution optical spectra were obtained.
The spectra (Figure 1b) cover the key UV spectral range including the wavelength (368.6 nm) of the Balmer jump at 3686 A. These spectra turn out to be extremely interesting: the Balmer jump is present, indicating the presence of hydrogen recombination radiation, but at longer wavelengths we can make a good fit (shown with a red line in Figure 1b) to a blackbody spectrum. Stellar astronomers often distinguish these two components - a long-wavelength blackbody term, and a short-wavelength recombination term; here the latter is obvious also because of the prominent Balmer emission lines. From fits to model spectra, the apparent blackbody source turns out to be only about 10% of the area of the recombination source.
Is this really like a solar flare?
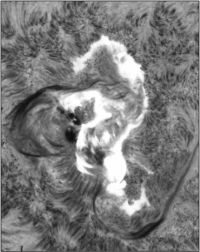
Few spectra of solar flares have comparable quality. On the other hand we have no idea what the spatial structure of the stellar flare is, except via modeling; on the other hand solar flares can be seen in excellent spatial detail. Figure 2 shows an image the celebrated flare of August 7, 1972, obtained in Hα, a member of the Balmer series but at a wavelength (656.3 nm) too long to appear on the stellar flare spectrum of Figure 1b.
EVE "sun as a star" EUV spectra

