File:Lc 15April2002 hsi ql.jpg
Original file (932 × 720 pixels, file size: 299 KB, MIME type: image/jpeg)
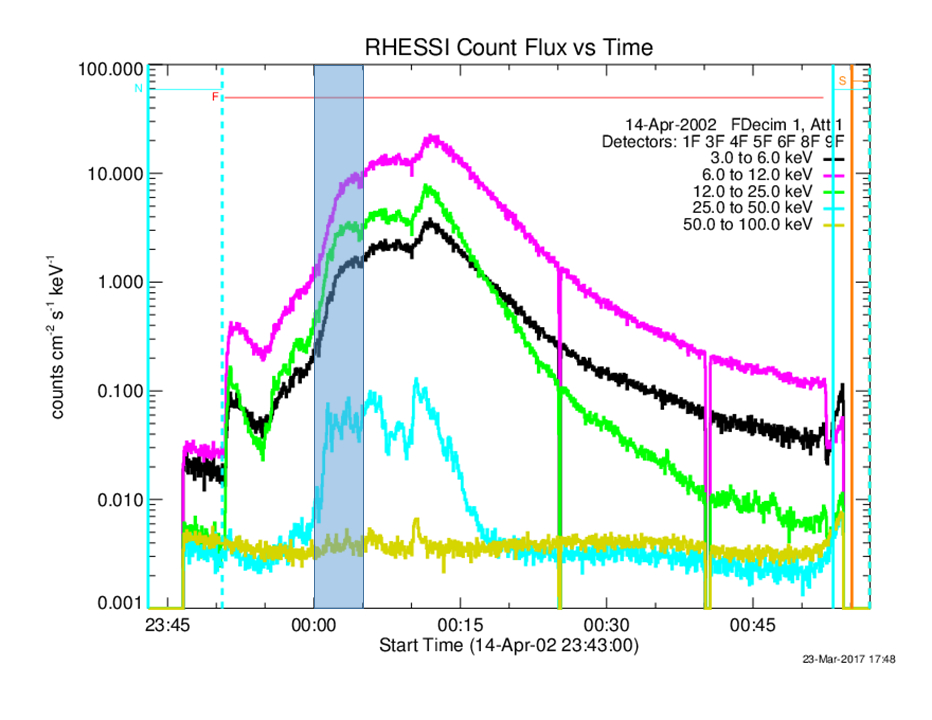
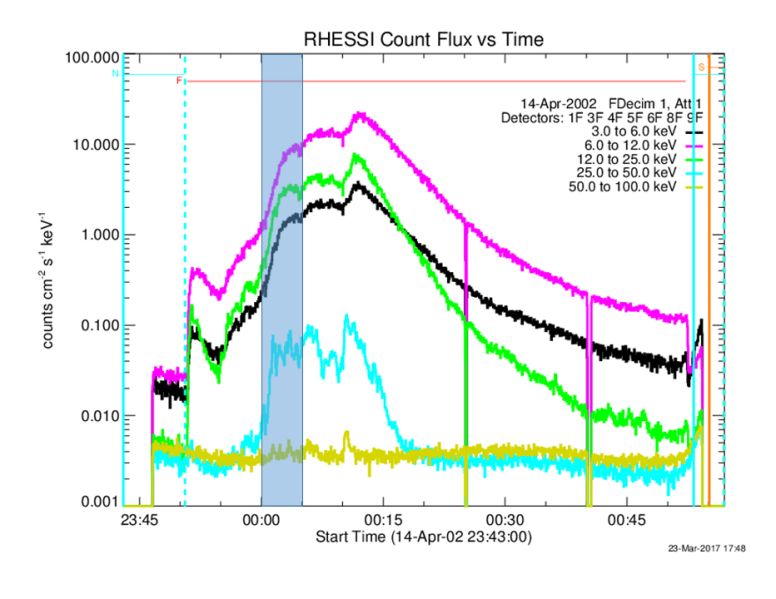
RHESSI light curves for the flare on 15 April 2002. The color-coded curves are for the five indicated energy ranges. Counts from the front segments of all detectors except for detectors #2 and #7 were summed and divided by the summed live times and the total effective sensitive area of 35.59 cm2 per detector to give the plotted values with a 4 s cadence to match the spacecraft spin period. The thin attenuators were in place above all detectors limiting the useful energy range to > 6 keV. The blue shaded areas show the first of the three time intervals between 00:00 and 00:05 UT used here and by Guo et al. (2012a, b, 2013) to determine the source dimensions.
File history
Click on a date/time to view the file as it appeared at that time.
| Date/Time | Thumbnail | Dimensions | User | Comment | |
|---|---|---|---|---|---|
| current | 14:34, 1 November 2024 | | 932 × 720 (299 KB) | Maintenance script (talk | contribs) | == Summary == Importing file |
You cannot overwrite this file.
File usage
The following page uses this file: