File:Figure3.png
Jump to navigation
Jump to search

Size of this preview: 276 × 599 pixels. Other resolution: 691 × 1,500 pixels.
Original file (691 × 1,500 pixels, file size: 586 KB, MIME type: image/png)
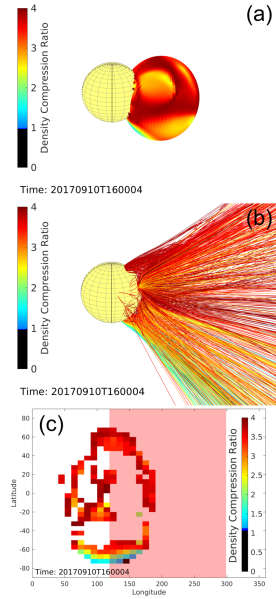
Panels (a) to (c): 3D view of the reconstructed pressure wave and the distributions of the modeled shock parameters along the front surface for the 2017 September 10 event at 16:00 UT. From left to right the panels shows the 3D distributions of the Alfvenic Mach number (MA), the density compression ratio (X), and the magnetic field obliquity with respect to the shock normal (thetaBN).
File history
Click on a date/time to view the file as it appeared at that time.
| Date/Time | Thumbnail | Dimensions | User | Comment | |
|---|---|---|---|---|---|
| current | 14:34, 1 November 2024 | | 691 × 1,500 (586 KB) | Maintenance script (talk | contribs) | == Summary == Importing file |
You cannot overwrite this file.
File usage
There are no pages that use this file.