File:161Fig1.png
Jump to navigation
Jump to search

Size of this preview: 559 × 600 pixels. Other resolution: 889 × 954 pixels.
Original file (889 × 954 pixels, file size: 118 KB, MIME type: image/png)
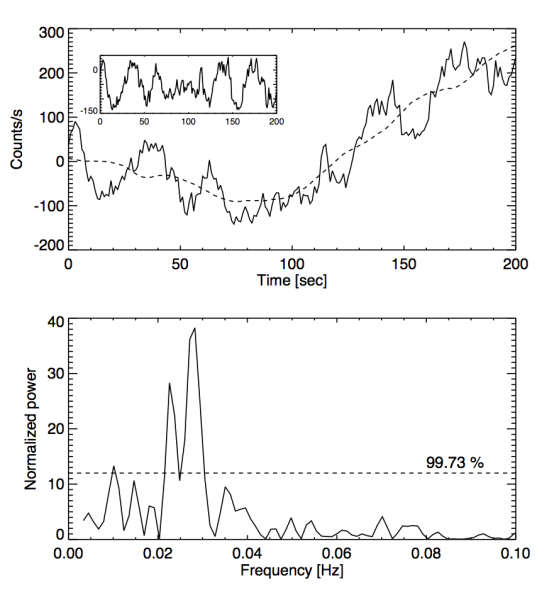
'Upper panel: Synthetic red-noise time series with a power law index of <math>\alpha=-1.8</math>. Simple (boxcar) moving average is overplotted (dashed line). The inset presents the residual signal. Middle panel: Lomb-Scargle Periodogram of the residual light curve. The <math>3\sigma</math> CL has been denoted by a dashed line
File history
Click on a date/time to view the file as it appeared at that time.
| Date/Time | Thumbnail | Dimensions | User | Comment | |
|---|---|---|---|---|---|
| current | 14:34, 1 November 2024 | | 889 × 954 (118 KB) | Maintenance script (talk | contribs) | == Summary == Importing file |
You cannot overwrite this file.
File usage
The following page uses this file: