File:Sp 15april2002 000000to000500 hsi mtpow thick2 albedo 5to60keV d4f.jpg
Original file (1,293 × 1,022 pixels, file size: 604 KB, MIME type: image/jpeg)
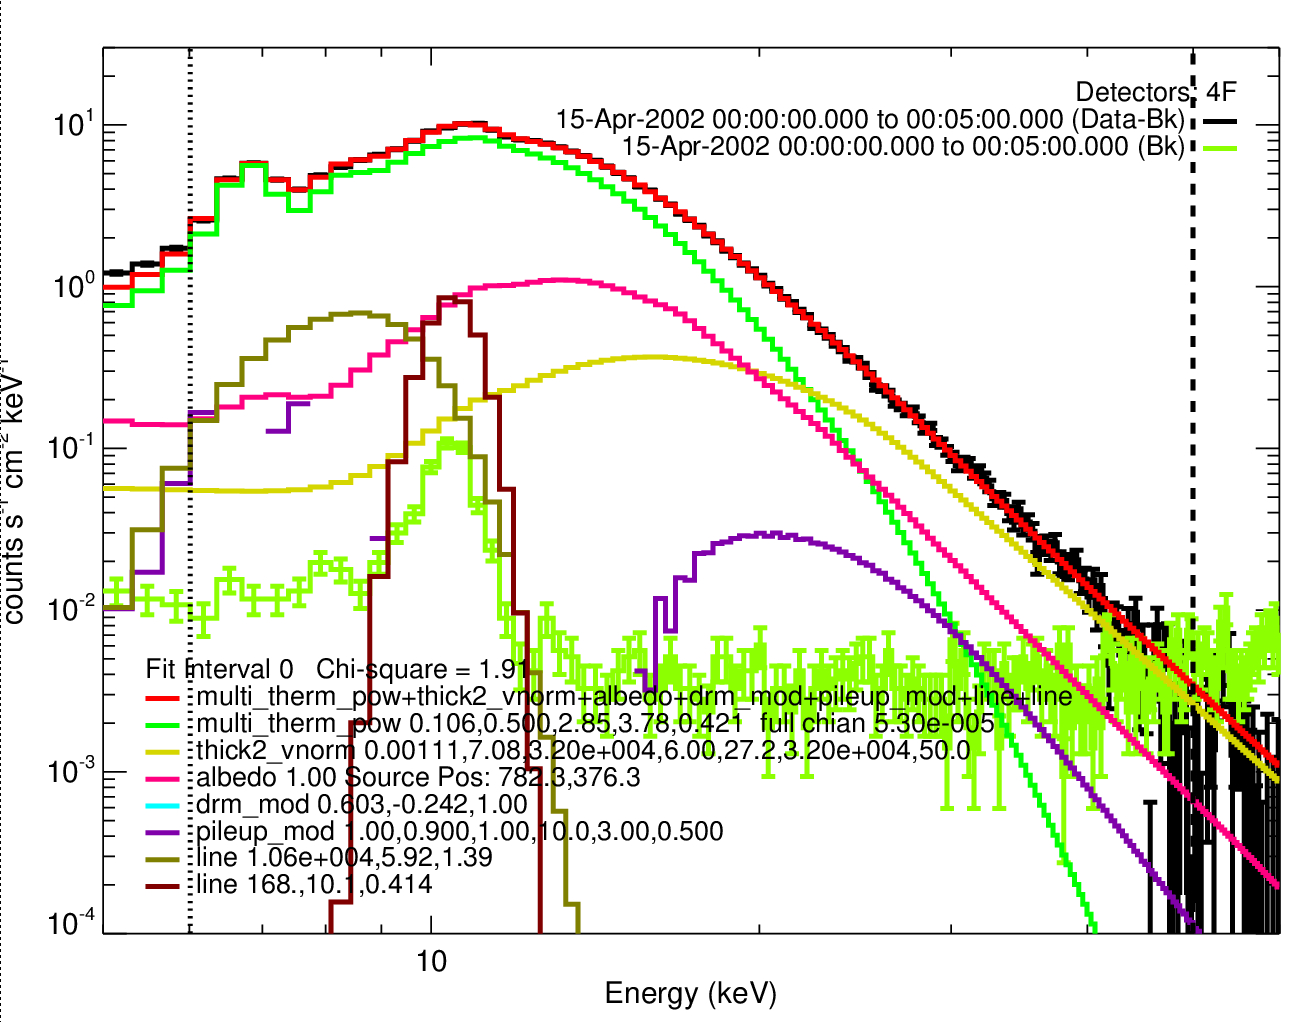
RHESSI count flux spectrum for the five-minute time interval shown in Figure 1. The black histogram is the background-subtracted count flux in the front segment of Detector #4. The red histogram is the function that was fitted to the data between 6 and 50 keV. It is the sum of the following components: a multi-thermal bremsstrahlung function (green), a power-law nonthermal thick-target function (yellow), an albedo function for isotropic emission (pink), the estimated pulse pile-up contribution (purple), and two Gaussian instrumental lines (olive and brown). The background spectrum (green) determined from the nighttime period immediately prior to the are is shown with +/-1 sigma error bars. The values of all parameters used for the fit are given for each functional component.
File history
Click on a date/time to view the file as it appeared at that time.
| Date/Time | Thumbnail | Dimensions | User | Comment | |
|---|---|---|---|---|---|
| current | 14:34, 1 November 2024 | | 1,293 × 1,022 (604 KB) | Maintenance script (talk | contribs) | == Summary == Importing file |
You cannot overwrite this file.
File usage
The following page uses this file: