File:212f1.png
Jump to navigation
Jump to search

Size of this preview: 799 × 354 pixels. Other resolution: 1,336 × 592 pixels.
Original file (1,336 × 592 pixels, file size: 83 KB, MIME type: image/png)
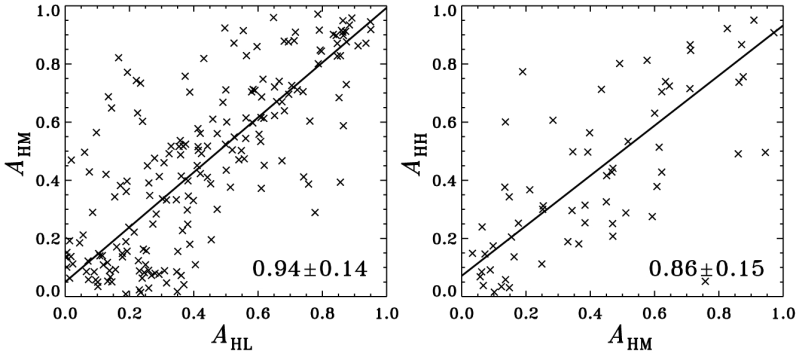
Comparison of HXR footpoint asymmetry in different energy bands for all the selected flares, where the subscripts HL, HM, and HH represent the unsigned AH values derived from the defined low, medium, and high energy bands, respectively. A linear least-square fitting is denoted by the straight line in each plot to quantify the correlation.
File history
Click on a date/time to view the file as it appeared at that time.
| Date/Time | Thumbnail | Dimensions | User | Comment | |
|---|---|---|---|---|---|
| current | 14:35, 1 November 2024 | | 1,336 × 592 (83 KB) | Maintenance script (talk | contribs) | == Summary == Importing file |
You cannot overwrite this file.
File usage
The following page uses this file: