Weekly Report 11Mar2011
RHESSI Albedo Imaging Test
An IDL routine was written that allows a map to be created, from the map a calibrated eventlist file is made, and from the calibrated eventlist file, an image is made. For each image, the Full Width Half Max was calculated in the X and Y directions. This was compared to the FWHM of the original map.
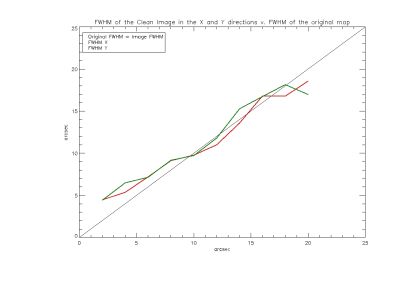
For the case below, the FWHM of a circular Gaussian is plotted versus the FWHM in the X and Y direction for clean images.
The Red line is the FWHM in the X direction. The Green line is the FWHM in the Y direction. They are plotted versus the FWHM of the of the original image which is symmetric. The X=Y line shows the points were the FWHM of the image should be equal to the FWHM of the original map.
The side lobes present in the original Pixon maps were found to be a product of the detectors used. When detectors 1,2 and 3 were removed the side lobes disappeared.
