A Hot Cusp-Shaped Confined Solar Flare
| Nugget | |
|---|---|
| Number: | 371 |
| 1st Author: | Aaron Hernandez-Perez |
| 2nd Author: | (see Acknowledgments) |
| Published: | 24 February 2020 |
| Next Nugget: | The flaring photosphere |
| Previous Nugget: | The Temporal and Spatial Extension of Gamma-ray Emission from the Sun |
Introduction
A growing cusp-shaped flare arcade is a typical feature in the standard model of eruptive flares, and is regarded as a signature of magnetic reconnection taking place at progressively larger coronal heights. This feature resulted from 2D approximations to the process, while an earlier Nugget described a generalization to 3D. As reconnection occurs at successively larger heights in the solar corona, the outer flare loops have systematically higher temperatures than the previously reconnected ones, located underneath. We report (Ref. 1) rare observations of a confined flare that exhibited an apparent cusp with a temperature distribution distinctly different from those reported in literature, exhibiting an increasing temperature with increasing height even in the absence of an eruption.
An Atypical Flare Loop
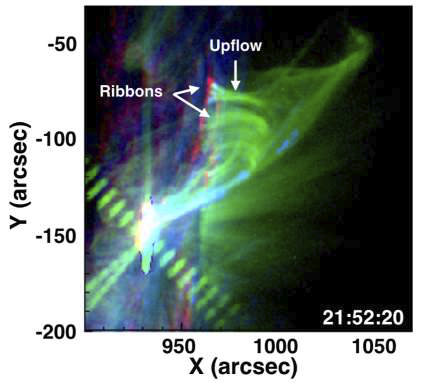
The flare SOL2014-01-13T21:51 appeared in the low corona at the location of substantial nonthermal precursor activity. Particle acceleration related to magnetic reconnection, subsequent plasma heating and chromospheric evaporation, revealed cusp-shaped flare loops extending almost 70 Mm into the corona (Figure 1).
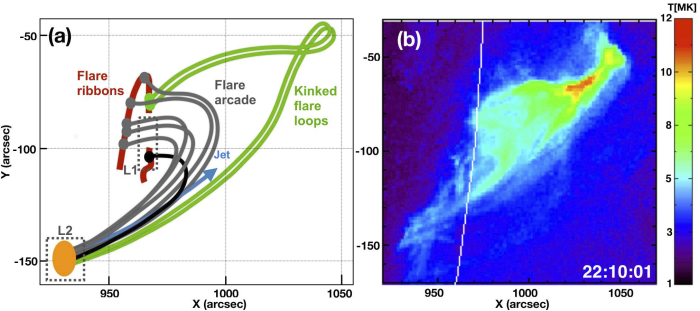
After the impulsive phase, RHESSI X-ray emission, of a partly nonthermal nature, originated from the cusp-shaped structure. This indicates continued particle acceleration during the decay phase (Figure 2). Prolonged hot emission was further observed, consistent with ongoing energy release in the apparent cusp (Figure 3(b)).

Conclusion
Given the observational characteristics, the cusp-shaped appearance of the flare was most probably related to a kinked shape of the magnetic field (Figure 3(a)). The extended enhanced SXR and EUV emission during the late phase provides evidence of a weak process of ongoing energy release. This can also explain the increasing temperature distribution with height observed during the decay phase (Figure 3(b)).

Acknowlegements
Co-authors
