Blue-wing enhancement of the Mg II h and k lines in a flare
| Nugget | |
|---|---|
| Number: | 320 |
| 1st Author: | Akiko TEI |
| 2nd Author: | |
| Published: | 8 April 2018 |
| Next Nugget: | A Sunspot from Cycle 25 for sure |
| Previous Nugget: | NuSTAR detects X-ray flares in the quiet Sun |
Introduction
During a solar flare, the solar chromosphere undergoes violent disruptions as the entire atmosphere accommodates to a new configuration. Imaging spectroscopy, especially in visible-UV-EUV wavelengths, lets us study the dynamics. Redshifts and red-wing enhancements (red asymmetries) appear in chromospheric lines (e.g., Ref [1]), with a natural interpretation in terms of a chromospheric condensation produced by a coronal pressure enhancement, which results in compression and physical downflow in the chromosphere. On the other hand, blue asymmetries in chromospheric lines have also been reported (e.g., Ref [2]). Some researchers have attempted to explain the origin of these blue asymmetries, but we have not obtained consensus.
In this Nugget, we report extensive multi-wavelength observations of a recent solar flare, which shed some light on this interesting problem.
The moving flare kernel observed by IRIS and DST at Hida
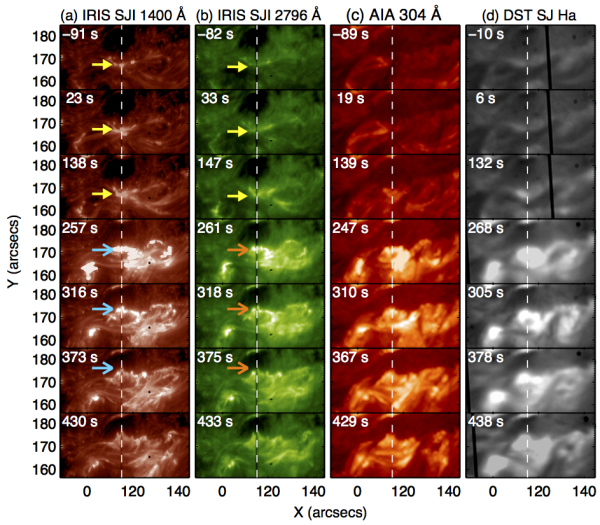
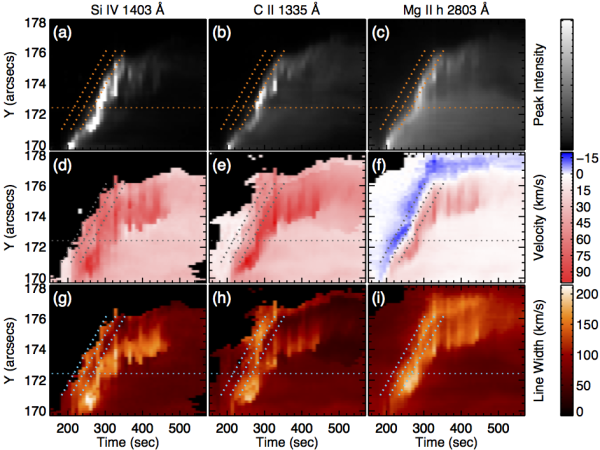
A C-class flare (SOL2014-11-11, in NOAA region 12205), was observed by the Interface Region Imaging Spectrograph (IRIS) and the Domeless Solar Telescope (DST) at Hida Observatory. We observed an interesting flare, specifically a moving emission kernel, using spectral data in the Si IV 1403, C II 1335, and Mg II h and k lines from IRIS and the Ca II K, Ca II 8542, and H lines from DST. See Figures 1 and 2.


Blue-wing enhancement in the Mg II h and k lines
A large redshift was a common property for all the six lines of Si IV 1403, C II 1335, Mg II h, Ca II K, Ca II 8542, and Hα, but a blueshift prior to it was found only in the Mg II h line. The blueshift lasted for 9-48 s with a typical speed of 10.1+-2.6 km/s, and it was followed by high intensity at a large redshift with a speed of up to 51 km/s. The blueshifted profiles of the Mg II h line showed an intensity enhancement in the blue wing, and a smaller intensity of the blue-side peak (h2v) than that of the red-side one (h2r). These characteristics are the same for the Mg II k line (see Figure 3).

A cool upflow scenario
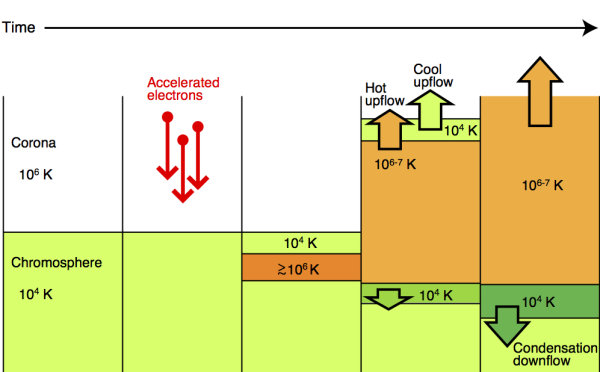
A cloud modeling of the Mg II h line suggests that the blue wing enhancement with such a peak difference can be caused by a chromospheric-temperature (cool) upflow. Ref. [3] discusses a scenario in which an upflow of cool plasma is lifted up by expanding hot plasma owing to the deep penetration of non-thermal electrons into the chromosphere (see Figure 4).

Conclusion
Multi-wavelength observations of chromospheric dynamics, at high resolution, are now becoming available from ground-based (visible) and space-based (UV) imaging spectroscopy. The flare observations discussed here suggest that the vertical motions involved in the "evaporation" flow of chromospheric material into the corona require a complicated temperature structure, with cool material overlying the site of energy deposition.
References
[1] "Hα red asymmetry of solar flare"
[2] "Hα spectra of dynamic chromospheric processes in five well-observed X-ray flares"
[3] "Blue wing enhancement of the chromospheric Mg II h and k lines in a solar flare"