Flare Observations of the EUV Continua
| Nugget | |
|---|---|
| Number: | 167 |
| 1st Author: | Ryan Milligan |
| 2nd Author: | |
| Published: | 16 January 2012 |
| Next Nugget: | Supra-Arcade Downflows |
| Previous Nugget: | No Hard X-rays from Comet Lovejoy |
Introduction
It has long been known that the bulk of the energy deposited in the chromosphere by non-thermal electrons during solar flares is re-radiated in the form of continuum emission, particularly the Balmer continuum of hydrogen as inferred from white-light observations. However, bona fide spectroscopic detections of this portion of the solar spectrum have been rare, as are observations of the less energetic, but by no means less interesting, Lyman and helium continua. During the 1970's, chromospheric continuum observations were much more prevalent due to instruments onboard Skylab and the Orbiting Solar Observatory (OSO) series of satellites. Around the same time, broadband observations of changes in the ionospheric density of earth's atmosphere were being used to show that the solar EUV flux from 1-103 nm (which comprises free-free and free-bound emission, as well as myriad emission lines) rises and falls during flares in correlation with hard X-ray (HXR) emission, typically around 10-20 keV. Understanding how different continua contribute to the overall energy of flares, including the depth of the atmosphere at which it is emitted and the mechanism(s) by which it is generated, is crucial for corroborating solar flare models and may be useful for inferring properties of the accelerated particles themselves.
In this nugget we present new observations from the EUV Variability Experiment (EVE) instrument onboard SDO which show unambiguous, spectrally and temporally-resolved detections of the enhanced EUV continua during the first X-class flare of Solar Cycle 24. Here we focus on the free-free (bremsstrahlung) continuum, and on the free-bound (recombination) continua of hydrogen and helium. Although EVE was primarily designed to measure the variations in the solar EUV irradiance on a range of timescales, and with high precision, these data, in conjunction with X-ray observations from RHESSI, highlight EVE's ability to help answer long-standing, fundamental questions on solar flare energetics.
Enter EVE
EVE acquires full disk (Sun-as-a-star) EUV spectra every 10 seconds over the 6.5-37 nm (65-370 A) wavelength range using its MEGS-A (Multiple EUV Grating Spectrographs) component with a near 100% duty cycle. Its MEGS-B component, which covers the 37-105 nm wavelength range, and MEGS-P component, a broadband (10 nm) diode covering the Lyman-alpha line at 121.6 nm, only acquire data for three hours per day, and 5 minutes every hour. The reduced operations minimize instrument degradation. However, for one or two days per month, particularly if the Sun is active, MEGS-B and MEGS-P take data continuously to measure changes in the EUV irradiance during the largest eruptive events. During one such campaign (14-16 February 2011), the first X-class flare of Solar Cycle 24 occurred (an X2.2 flare which began at 01:44 UT; SOL2011-02-15T01:44). Figure 1 shows the EVE spectrum (background-subtracted) taken at the SXR peak of the flare.

Continuum Energetics
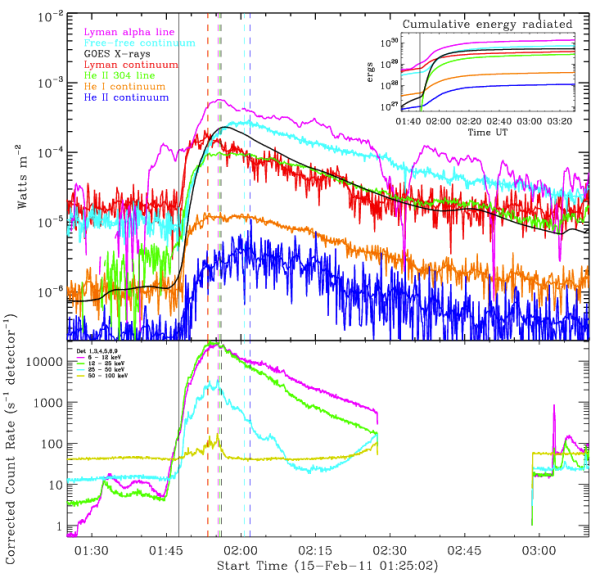
By fitting the emission blue-ward of each recombination edge with a simple exponential function at 10 s cadence, lightcurves of the integrated emission can be generated to estimate the timing and magnitude of each continuum. The top panel of Figure 2 shows these lightcurves, as well as those of the Lyman-alpha line, the He II 30.4 nm line, and the GOES 0.1-0.8 nm SXR emission for comparison. The bottom panel shows the HXR emission observed by RHESSI. This shows that the Lyman and He I continua, as well as the Lyman-alpha and He II lines, all peak around the time of the 50-100 keV emission. The free-free continuum peaks much later, later even than that of the GOES emission, due to its thermal nature. This may in turn may affect the timing of the He II continuum which is superimposed on top of it.

Having generated the individual lightcurves for each process, integrating them over the course of the flare reveals just how much energy was emitted by each process. This is illustrated by the inset in Figure 2 which shows the cumulative energy radiated. The values are listed in the table below.
| Wavelength range (nm) | Energy (ergs) | |
| Lyman-alpha line | 116.6-126.6 | 1x10^30 |
| Free-free continuum | 6.5-37 | 8x10^29 |
| GOES X-rays | 0.1-0.8 | 5x10^29 |
| Lyman continuum | 60-91.2 | 4x10^29 |
| He II 30.4 line | 30.29-30.49 | 3x10^29 |
| He I continuum | 44-50.4 | 4x10^28 |
| He II continuum | 21-22.8 | 1x10^28 |
If we compare these values with that of the total energy of a typical X-class flare (~1032 ergs) we find that the continuum emission is at most a few percent of the total, and that there is a similar amount of energy in the Lyman continuum compared to that contained in the GOES X-rays. The next step will be to compare these values with the energy contained in the non-thermal electrons deemed to be responsible.
Conclusions
This Nugget, in addition to previous ones ([1], [2) shows in a different way how SDO/EVE observations can be used for fundamental flare science. Although these data show that the EUV continuum emission is less energetic than its UV counterpart, EVE now gives us the first ever look at these diagnostically important emissions on a regular basis.
Biographical Note
Ryan Milligan is currently a Leverhulme Trust Research Fellow working at Queen's University Belfast. This nugget is based on recent work