HOPE during high activity
| Nugget | |
|---|---|
| Number: | 475 |
| 1st Author: | Hugh HUDSON |
| 2nd Author: | Alphonse STERLING |
| Published: | |
| Next Nugget: | Flare electrodynamics |
| Previous Nugget: | Simulated heliospheric electron spectra show sensitivity to plasma properties of a source region in the flaring corona |
Introduction
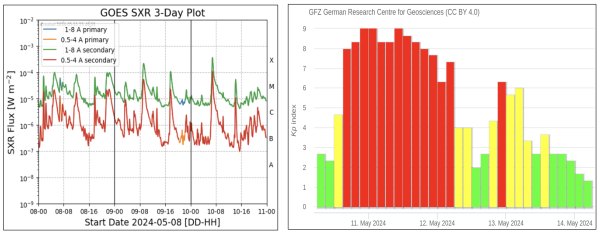
The major solar activity (sunspots, flares, CMEs) of early May 2024 led to huge geomagmetic storms a few days later. Figure 1 illustrates this with solar and geomagnetic indices.
An earlier Nugget described how the HOPE (the hot onset precursor event) (Ref. [1]) could lead to a robust means for flare anticipation. Invariably, at least during sparse activity, the HOPE diagnostic appears many minutes before the impulsive phase (Ref. [2]) of the flare, and therefore well before the GOES flare maximum. The huge activity in early May 2024 gives us a chance to see how HOPE works during overlapping major flare events, in which an earlier flare may interfere with the HOPE development for a subsequent event.
The major flare SOL2024-05-10
This quite recent major flare (GOES class X3.9) gave us a good chance to test how well the observational signature of the HOPE process could be detected at the highest levels of solar activity. Figure 2 shows the flare and the geomagnetic storm in crude imagery; on the left an EUV image from the SDO/AIA observatory. This flare was well observed by many observatories, and future Nuggets will probably consider further. The right panel is a picture of the aurora borealis as recorded in Mazatlán, Mexico, at the remarkably low geomagnetic latitude of 21 degrees South.

HOPE behavior
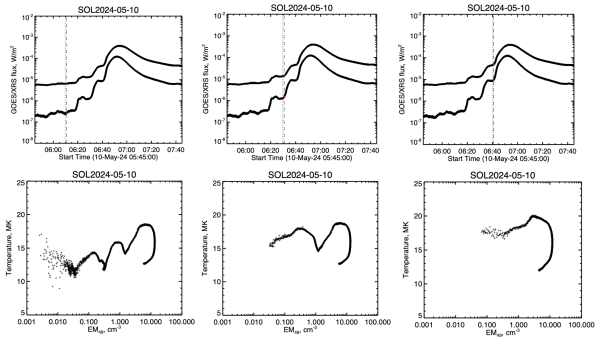
The key HOPE signature in the GOES soft X-ray data comes from the time dependence of its isothermal fit parameters, temperature T and emission measure EM (basically the quantity of emitting plasma as represented by the product n2V combining the density and volume, for emission based on particle collisions). The [EM,T] point moves a characteristic pattern; the HOPE is a horizontal motion reflecting EM growth at near-constant T. Our big flare SOL2024-05-20 tests the recognizability of this pattern for extreme conditions.
Figure 3 shows that HOPE appears systematically in this event, but also demonstrates the need for background subtraction, as shown at three specific times. An alternative to this "base difference" recognition of this pattern, which is a bit cumbersome, one can also do a "running difference", which we find to work well with a 5-minute step.

Conclusion
The HOPE signature appears clearly even in extreme conditions; each impulsive event has a precursor hot phase.
References
[1] "Anticipating Solar Flares"
[2] "Observations of Two Components in Energetic Solar X-Ray Bursts"
