Microwave Imaging Spectroscopy of Flares is Here
| Nugget | |
|---|---|
| Number: | 327 |
| 1st Author: | Dale E. Gary |
| 2nd Author: | EOVSA and RHESSI Teams |
| Published: | 16 July 2018 |
| Next Nugget: | The true dawn of multimessenger astronomy |
| Previous Nugget: | Coronal nanoflares powered by footpoint reconnection |
Introduction
The Expanded Owens Valley Solar Array (see our early EOVSA Nugget) is now fully operational, and obtained mutli-frequency microwave (MW) images and movies of the spectacular flares of September 2017 in the frequency range 2.5-18 GHz, with 1 s time resolution. A paper describing the first science results from EOVSA is now available (Ref. [1]), as summarized here and below.
The 2017 September 10 X8.2 Flare
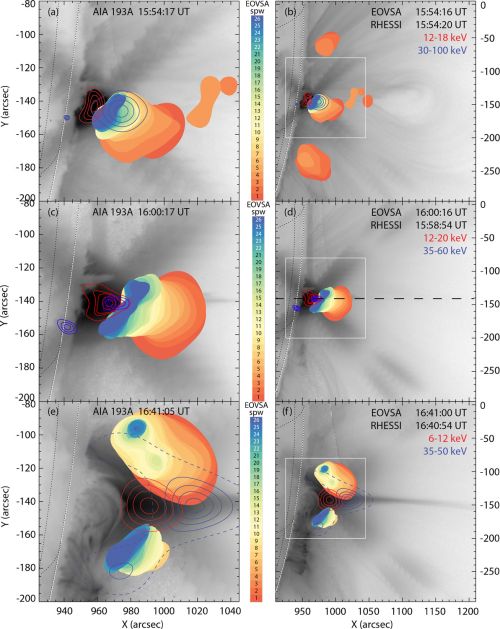
The flare SOL2017-09-10, in NOAA AR 12673 reached GOES soft X-ray class X8.2. Figure 1 shows the EOVSA microwave (MW) and RHESSI hard X-ray (HXR) images at three times during the event, overlaid on AIA 193 Â EUV images. As usual for large limb events, the RHESSI thermal (~12 keV) sources are associated with the brightest EUV-emitting loops, while the nonthermal (~50 keV) coronal sources are higher, but still well centered above the growing EUV-emitting, cusp-shaped source. The MW sources, which generally come from much higher energy (~300 keV) electrons, are still higher and show some asymmetry in the emitting region, especially at later times when the MW source bifurcates and seems to avoid the densest part of the plasma sheet.

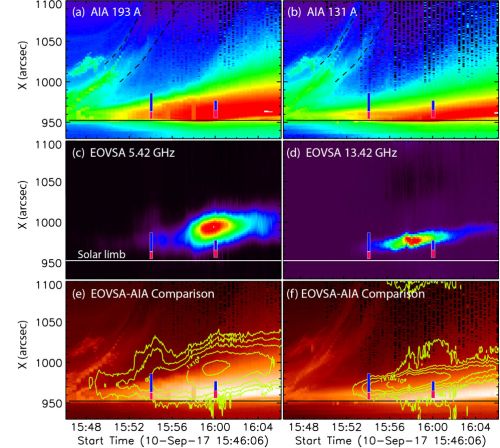
Figure 2 shows height-time stackplots of AIA, EOVSA and RHESSI data taken along the dashed line in Figure 1d. This shows the steady rise in radio sources at exactly the same rate as the growth of the EUV loops, so that the radio source maintains its spatial relationship to the EUV-bright loops.

MW Imaging Spectroscopy
The multi-frequency images at each moment in the flare form a spatial-spectral data-cube, which can be displayed as multi-frequency images, as illustrated in Figure 3a, at 28 frequencies (from 3.4 to 16.9 GHz) for the 15:54 UT time. The frequency content of these images can be visualized as in the “true-color” image in Fig. 3f, where the images at 28 frequencies are apportioned different red-green-blue weights according to their frequency. In addition to displaying images at different frequencies as in Figure 3a, we can display spectra at different spatial locations, as in Fig. 3b-e, which are line-of-sight spectra obtained at the 4 points labeled in Fig. 3f. The data points in Fig. 3b-e can be fit with gyrosynchrotron emission spectra from a multi-parameter homogeneous source, and the fit parameters (the magnetic field strength B and power-law index delta parameters are shown as text in each panel). Although these fits are preliminary, and shown only to illustrate the technique, it is clear that the changing spectral shape over the emission region reflects varying parameters vs. location in the source that can be exploited for imaging spectroscopy, including dynamic coronal magnetography (Ref. [2]).

Conclusions
This EOVSA first-science paper barely scratches the surface of the potential of the data for learning new details on the energy release, particle acceleration and transport in solar flares. Similar results as Fig. 3, both at other times in SOL2017-09-10 and in other flares (e.g. SOL2017-09-04 and SOL2017-09-09) are now being studied in detail, together with 3D modeling with GX Simulator. EOVSA has obtained such data on more than 100 flares in 2017 (very few so far in 2018 due to declining solar activity), as well as active regions. See the EOVSA web site for more details.
References
[1] "Microwave and Hard X-Ray Observations of the 2017 September 10 Solar Limb Flare"
[2] "Magnetography of Solar Flaring Loops with Microwave Imaging Spectropolarimetry"