New insights into the proton precipitation sites in solar flares
| Nugget | |
|---|---|
| Number: | 489 |
| 1st Author: | Andrea Francesco BATTAGLIA |
| 2nd Author: | Säm KRUCKER |
| Published: | 10 February 2025 |
| Next Nugget: | Rapid variations |
| Previous Nugget: | Solar Gamma-Ray Evidence for a Distinct Population of MeV Flare-Accelerated Electrons |
Introduction
Solar flares involve huge fluxes of particles accelerated to very high energies, both ions and electrons. These particles link the corona to the lower atmosphere, and one of RHESSI's major discoveries involved the observation of apparently distinct precipitation sites for electrons and protons. Here (Ref. [1]) we revisit RHESSI observations of the extraordinary GOES X25 flare SOL2003-10-28T11:10, and add new considerations from white-light (WL) images in order to investigate the previously reported conclusion.
Flare-accelerated electrons and protons in the corona lose most of their energy by collision or by radiation upon reaching and colliding with the much denser chromosphere. In the hard X-ray (HXR) and γ-ray ranges, part of this radiation is bremsstrahlung emission continuum. Additionally, protons and ions produce spectral lines in the γ-ray range through nuclear processes. For instance, upon collision with ambient ions, different nuclear de-excitation lines are produced from 0.8 MeV to 10 MeV, such as those of 12C and 16O. These lines are prompt, meaning that there is no measurable time delay. The nuclear interactions produce free neutrons, which can coalesce with protons to form the neutron-capture line at 2.223 MeV. It is the most appealing spectral feature for γ-ray imaging reconstruction of flares as it is usually the brightest line, and the better counting statistics aid in the reconstruction process. However, caution is needed here, since this line, which is emitted upon the capture of a neutron by ambient hydrogen (forming deuterium), has a delay between the generation of the neutron and its capture (Ref. [2]). The reason for this delay is the time required for the thermalization of the neutrons prior to their capture. The timescale of the generation of the neutron-capture line is about 100 s (Ref. [3]). This delay needs to be considered during the indirect imaging reconstruction process.
Time histories of SOL2003-10-28
Although the RHESSI passage through the South Atlantic Anomaly prevented the rising and peak of the impulsive phase from being recorded, the exceptional magnitude of the flare allowed for significant HXR and γ-ray flux observations during the decaying phase. As a reference for the impulsive phase, we use observations provided by the INTEGRAL spacecraft.
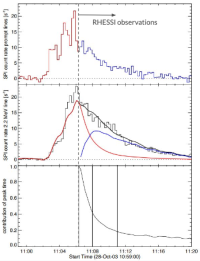
In contrast to previous works that reconstructed 2.223 MeV images over extended time periods (20 minutes), we selected shorter integration times on the order of 2 to 3 minutes. Because of the delayed emission of the neutron-capture line, this turns out to be an important factor in the imaging reconstruction process. Using simulations of the 2.223 MeV time profile (Ref. [3]) in combination with observations of the prompt γ-ray lines from INTEGRAL, we obtained two separated integration time ranges for RHESSI representing the peak of the flare and the start of the decay, respectively. This is illustrated in Figure 1.

Our analysis employs a new approach that uses three main improvements: (1) Much shorter integration times; (2) Selected time intervals derived from observations of prompt γ-ray lines in combination with simulations of neutron-capture process (Ref. [3]), and (3) Comparison of the -ray images to WL observations by GONG at the time of the peak of the prompt -ray emission. Such an approach allows us to disentangle the effects of the delayed nature of the neutron-capture line and carefully compare the location of sources, which vary differently in time over different energy ranges, over shorter integration times.
Optical (WL), EUV, HXR, and γ-ray images
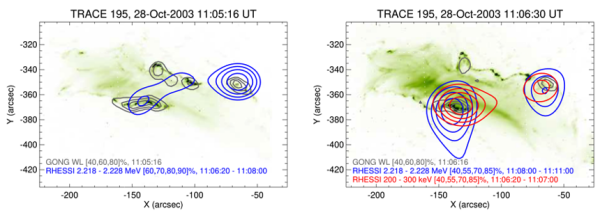
Figure 1 shows that for the first 100 s after the start of the RHESSI observations, the 2.223 MeV signal mainly derives from protons that are accelerated at the peak of the flare. Hence, by comparing the 2.223 MeV image reconstructed from this first part with the Wl sources at the peak time, we can directly compare the precipitation site of flare-accelerated protons relative to the flare ribbons. This is done in the left panel of Figure 2, which shows a nice agreement between the WL and γ-ray locations. The HXR images for this time interval are of course missing, but the general close association of WL and HXR flare ribbons sources reported in the literature (e.g., [4]) strongly suggests that electron and proton precipitation regions are indistinguishable. Similarly, during the peak time, the right panel compares the images during the decay phase and we can clearly see agreement between γ-ray, WL and HXR images, further confirming the colocation of electrons and protons.

Conclusions
We point out that previously reported results comparing RHESSI hard X-ray (HXR) and γ-ray images only hold if the relative time evolution in the two energy ranges is the same. As the decay time for SOL2003-10-28 is different at the two energy ranges considered (200-300 keV and around 2.223 MeV), the previously published conclusion that electrons and protons precipitate at different locations (Ref. [5]) is an overstatement. Using shorter integration times reveals that the γ-ray and HXR sources spatially coincide with the WL flare ribbons. We conclude that electron and proton precipitation sites are the same, at least within RHESSIs imaging capabilities. This result solves the 20-year-long mystery surrounding the different previously reported electron and proton precipitation sites.
References
[1] "On the proton precipitation sites in solar flares"
[2] "Properties of Energetic Ions in the Solar Atmosphere from γ-Ray and Neutron Observations"
[4] "Correlation of Hard X-Ray and White Light Emission in Solar Flares"
[5] "Gamma-Ray Imaging of the 2003 October/November Solar Flares"