Rapid variations of Si IV spectra in a flare observed by IRIS at a sub-second cadence
| Nugget | |
|---|---|
| Number: | 440 |
| 1st Author: | Juraj LÖRINČÍK |
| 2nd Author: | |
| Published: | November 14, 2022 |
| Next Nugget: | TBD |
| Previous Nugget: | A Significant Sudden Ionospheric Disturbance Associated with a Massive Gamma-ray Burst |
Introduction
Solar flares emit radiation in most wavelength ranges. The emission lines formed in the solar transition region (TR) prove to be very informative as probes for analyzing how the energy is released during solar flares. Observationally we define the TR in terms of electron temperature Te in the range .01-1 MK (or by ionization state). An example of a line often employed to analyze plasmas of flare ribbons is the Si IV 1402.77 Å line (nominally formed at Te ~ 70,000 K). This is one of the strongest lines routinely observed by the IRIS satellite. Its profiles are typically redshifted in solar flares, and also broadened as a consequence of magnetohydrodynamic (MHD) turbulence. Some observational studies of Si IV line-broadening have reported high-frequency oscillations with periods of 10 s, in some cases accompanied by oscillations of other spectral properties of this line. This rapid variability in the line broadening presents a difficulty in studying the manifestations of the turbulence, highlighting the need for flare spectral observations carried-out at a very high cadence.
In this Nugget we describe rapid variability of the Si IV 1402.77 Å line in observations of the first major solar flare captured in a newly-designed IRIS observing mode enabling high time resolution (Ref. [1]).
Variability of Si IV line properties
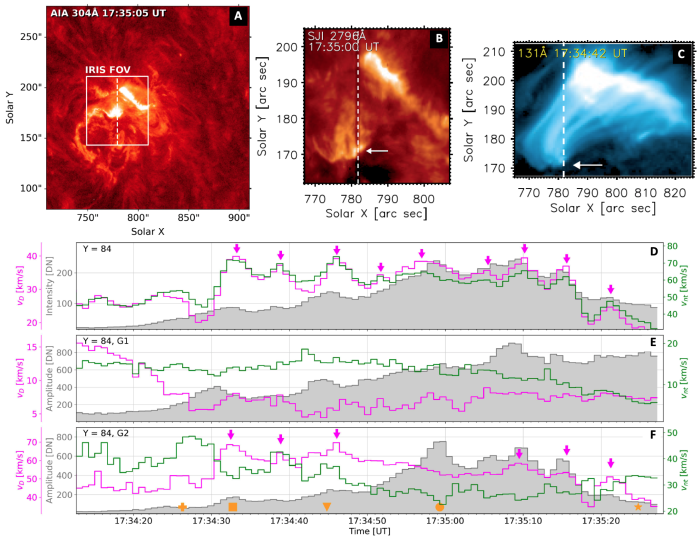
We analyzed observations of the M1.5-class flare SOL2022-01-18 (Figure 1A) observed by IRIS at an unprecedented 0.8 s cadence. The IRIS spectroscopy slit captured a bright kernel (panel (B)) in the southern ribbon corresponding to flare loop footpoints observed in SDO/AIA 131 Å; (panel (C)). The Si IV 1402.77 Å line spectra observed in this kernel were double-peaked, consisting of the primary component consistently located close to the line's rest wavelength and a well-resolved redshifted secondary component. In addition to the moments analysis typically used for this purpose, the properties of each of the Si IV profiles (intensity, Doppler velocity, non-thermal broadening) were therefore also determined by fitting two independent Gaussian profiles.

In agreement with previous studies (e.g., Ref. [2]), the time evolution of the quantities determined using moments exhibited high-frequency oscillations (Figure 1(D)). The oscillations of the non-thermal broadening with periods of roughly 7 s (green curve) that we primarily focused on in our work were found to be well-correlated with enhancements of the Doppler velocity of the secondary component of the line determined from the Gaussian fits (magenta curve in panel (F)). This means that the enhancements of the broadening of the entire profile determined via moment analysis were in fact dictated by varying redshifts of the secondary component, similar to what has been reported in spectral observations of active-region loops.
Our next task was to investigate what mechanism led to the formation of the secondary component of the line. The redshifts and the relatively-larger non-thermal broadening of the secondary component (c.f. panels (E) and (F)) suggest ongoing energization by magnetic reconnection, reflecting he downflows existed due to the "chromospheric condensation" required by models of solar flares. Upon estimating the speeds of field-aligned flows along flare loops emanating from the analyzed kernel we found that the observed Doppler shifts indeed do indeed correspond to strong condensation flows recently predicted in radiative-hydrodynamic models of flares (Ref. [3]].
Combining IRIS, radio, and SXR data
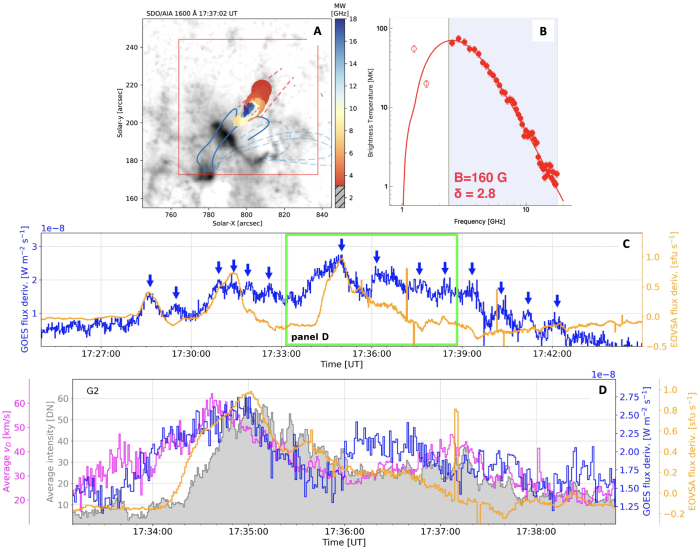
Evidence for an ongoing magnetic reconnection was found in observations of microwave flux from the EOVSA radio telescope. The dominant source of EOVSA emission was located above the arcade of flare loops (Figure 2(A)) and its brightness temperature spectrum was consistent with a non-thermal electron source (panel (B)). Moreover, the time derivative of the EOVSA radio flux (orange curve, panel (C)) showed several enhancements co-temporal with 1 - 3 minute quasi-periodic pulsations (QPPs) detected in the time derivative of the GOES SXR flux (blue arrows in the same panel). The lightcurve of the prominent QPP showed in panel (D) exhibited trends similar to the intensity and the Doppler velocity of the secondary component averaged in the ribbon, suggesting that some of these QPPs were likely driven by magnetic reconnection.

Conclusions
We have analyzed observations of the flare SOL2022-01-18 acquired at a sub-second cadence. We found that oscillations in the nonthermal broadening of the Si IV 1402.77 Å line profiles resulting from the moments analysis were more likely to be signatures of reconnection-driven condensation downflows rather than MHD turbulence. Magnetic reconnection leading to these condensation downflows was also a likely driver of QPPs observed in microwave radio and SXR spectra.
For further details see Ref. [1].
[2] "The development of lower-atmosphere turbulence early in a solar flare"
[3] "The Atmospheric Response to High Nonthermal Electron-beam Fluxes in Solar Flares. II."