The Superflare SOL2017-09-06: from submm to mid-IR
| Nugget | |
|---|---|
| Number: | 404 |
| 1st Author: | Guillermo GIMENEZ DE CASTRO |
| 2nd Author: | |
| Published: | 15 March 2021 |
| Next Nugget: | Lyman Alpha |
| Previous Nugget: | FLUKA as a tool for interpreting flare gamma-rays |
Introduction
Solar flares famously emit radiation across all electromagnetic wave bands, but we first accessed the mid-infrared (10 μm or 30 THz) only recently (Ref. [1]). The M2-class flare SOL2012-03-13T17 showed up clearly in the mid-IR, and also as a white-light flare that could be interpreted as optically thin thermal emission from precipitating electrons, as described via numerical models. Since that time several other mid-IR flares have been reported, and now we describe the remarkable X9.3 "superflare" SOL2017-09-06T12.
The superflare was one of a series of major events occurring in active region NOAA 12673, and the observations described here include mm-wave (212 and 405 GHz) observations as well as novel mid-IR imaging at 17 arc s resolution.
Observations
The mid-IR observations were obtained from a 15-cm telescope mounted on the roof of the CRAAM laboratory in the heart of São Paulo, Brazil (Ref. [2]). This Hale-type coelostat now feeds an uncooled microbolometer array with digital output at 320x240 pixels, matching the diffraction limit at 17 arc sec (Figure 1).

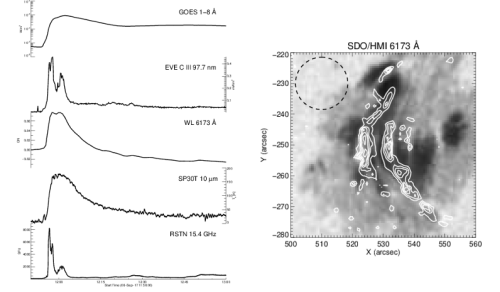
With this unique facility, plus excellent sky conditions on the day of the flare, we could obtain 10-minute movies at a 1-sec cadence. These revealed dark spots, as expected from the pioneering work of Ref. [3], in particular at the location of AR 12673. The flare produced striking changes that we could characterize by wavelet transforms and fitting to a 2D Gaussian emission profile, and thus obtaining the clean 10 μm light curve that we compare, in Figure 2, with diverse other signatures.

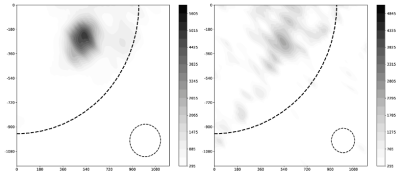
The Solar Submillimeter Telescope (SST), at El Leoncito in the Andes, executed raster scans at 212 and 405 GHz during the flare, producing the images shown in Figure 3.
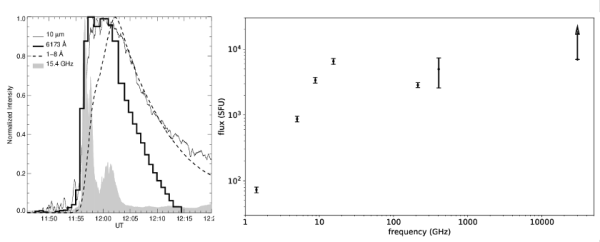
To compare the variations across the different spectral bands, we plot the normalized fluxes vs time in Figure 4 (left). The white light and mid-IR fluxes start and peak together, although the former decreases faster. The brightness temperature at 10 μ (Figure 2, left) should be considered as a lower bound since the spatial resolution of our camera is of the same order of the emitting source size. We cold assume that the mid-IR source is cospatial with the WL source, as described in Ref. [4] for a different event. But what we observe at 10 μ might be an average of dark and bright areas (see Figure 3 right). Note that we do not see an actual brightening but only the variations in the darkness of the spot (Figure 2). Adopting the WL emitting area for the mid-IR source size, we obtain a peak flux of F(10μ) = 7,000 SFU (about 10-4 W/m2 total energy flux).

From the spectrum at peak time (Figure 4, right ) we cannot determine the gyrosynchrotron turnover frequency at microwaves, which depends the density and magnetic field in the source. On the other hand, the submillimeter emission seems to come from a different mechanism and may not be co-spatial. It is not possible to determine whether the submillimeter emission (212 and 405 GHz) comes from a nonthermal source or not. Recent radiative hydrodynamic simulations have demonstrated that the mid-IR emission from solar flares may be accounted by optically thin thermal bremsstrahlung from increased ionization in the chromosphere under non-LTE conditions. But in general this first look at the broad mm-submm-IR spectral domain points to rich possibilities of interpretation as observations improve.
Conclusions
"Superflares" such as this one bring new clues to better understand different aspects of space-weather dynamics and perhaps the most relevant, that is, the physical origins of flares. The high-frequency radio spectrum and its connection with the heretofore unobservable infrared emission, is still a very new aspect of solar flare studies. This relation may also reveal the nature of the white-light emission for which we do not have a clear explanation at the present time despite 162 years of study.
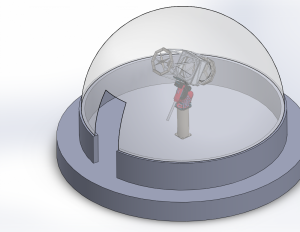
Observations at submillimeter to mid-IR frequencies are scarce, and many frequency gaps must be filled. We (at CRAAM) are about to deploy a new THz solar telescope, the High Altitude THz Solar photometer (HATS, Figure 5). This is based on a Golay cell detector and pass-band filters centered at about 15 THz (20 μ) that will be installed, as soon as the COVID-19 pandemic allows, at the Felix Aguilar Observatory in Argentina, at 2300 m altitude (ref. [5]).
References
[1] "A Bright Impulsive Solar Burst Detected at 30 THz"
[2] "The New 30 THz Solar Telescope in S&atild;o Paulo, Brazil"
[3] "High resolution solar images at 10 microns: Sunspot details and photometry"
[4] Spectral and Imaging Observations of a White-light Solar Flare in the Mid-infrared"
[6] "HATS: A Ground-Based Telescope to Explore the THz Domain"

