Weekly Report 13May2011
RHESSI Albedo Image Test
Active Region 375
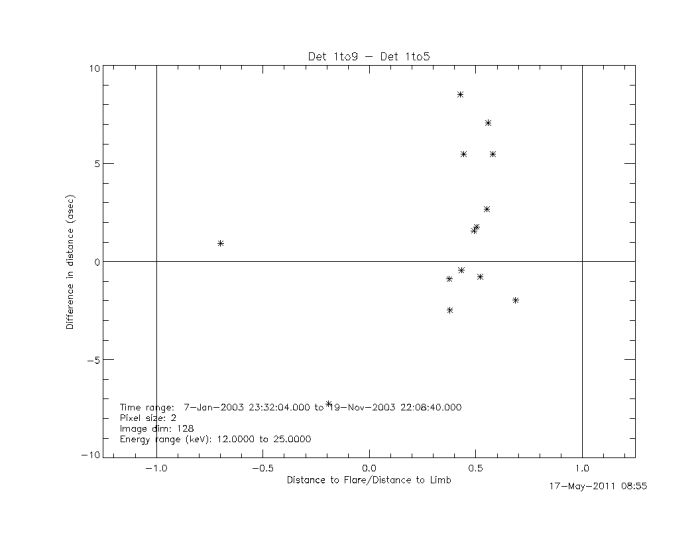
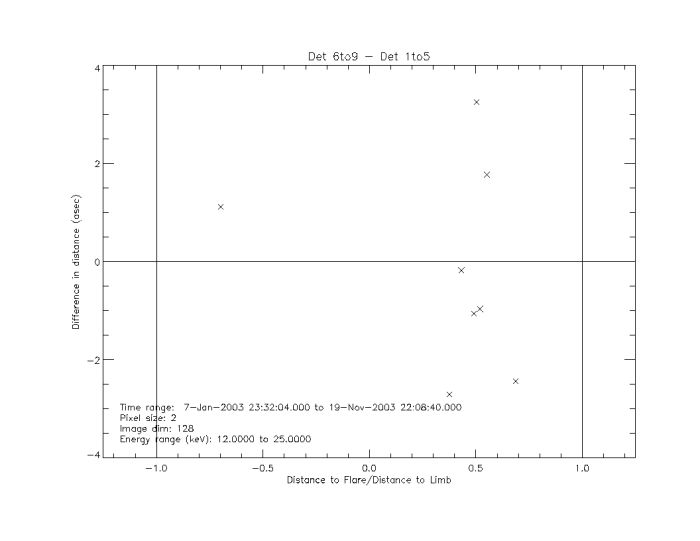
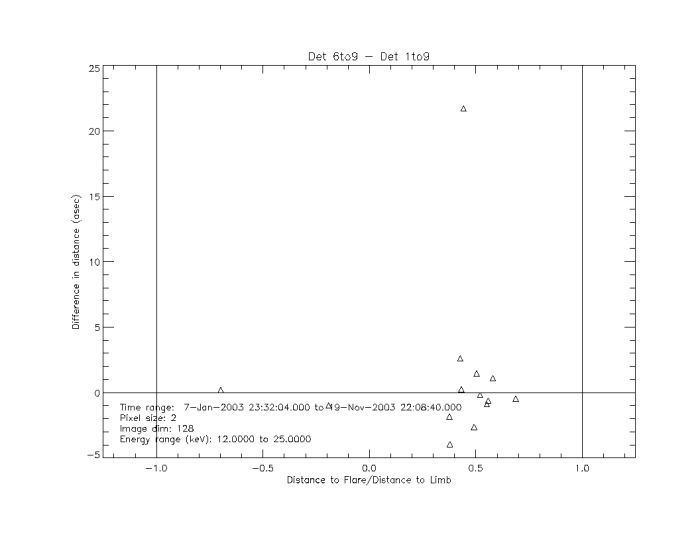
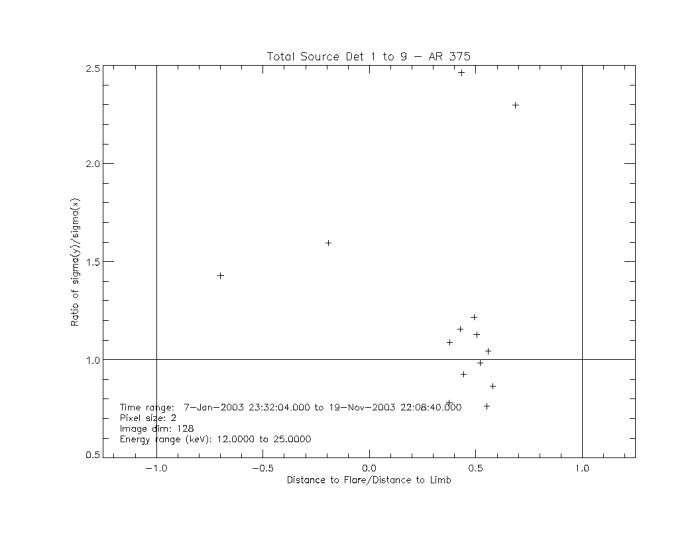
The following plots are for all flares that met the original selection criteria for counts in the 25keV - 50keV energy band. The following flares are all associated with Active Region 375.
These are once again from images made using the specs from previous weeks:
- Time: Decided by the peak of the 25keV-50keV energy band for each flare
- Energy: 12keV to 25keV, or 25keV to 50keV
- Detectors: 1 to 9, or 1 to 5,or 6 to 9
- Pixel Size: 2 arcsec by 2 arcsec
- Image Size: 128 pixels by 128 pixels
- Clean Beam Width Factor = 2
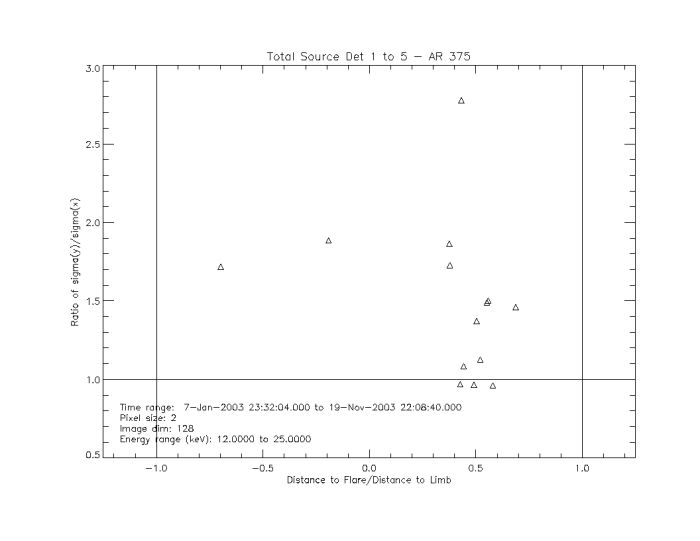
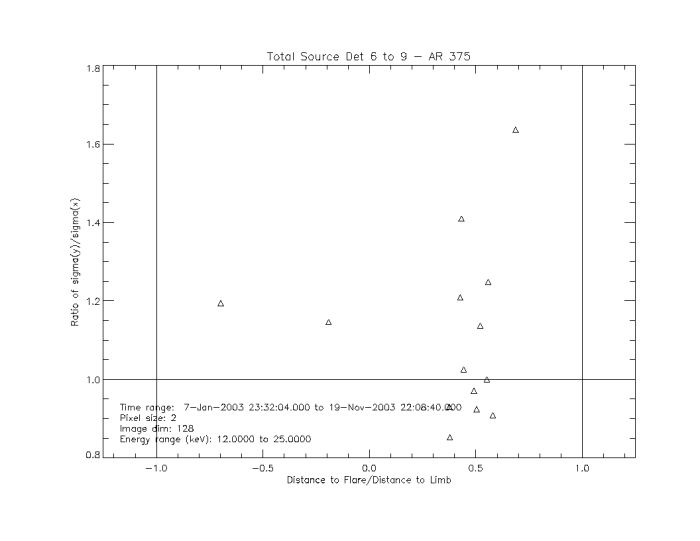
Clean images were made with each for each energy band with each detector combination. For each image the centroid of the source was measured, the total flux in the image was measured, and the standard deviation in the x and y direction for each source was measured. Using these measurements the plots below were made.
The plots were adjusted for the change in solar radius as observed from the earth at the time of the flare. All plots as a function of distance were made with an x axis as a ratio of the distance to limb at the time. An average value of 960 arcsec was added to the ratios for scaling purposes.
The flares from one active region were looked to see if a trend could be observed as it moved across the sun. In this case for active region 375 no trends were evident. The plots as a group are discussed below the group.
No immediate trends are observable in the data except for the grouping of flares around half the distance from the east limb of the sun. This line of study is continuing with other active regions.
Goals
- Running this analysis for all flares from the active region as it moves across the sun. In this case all flares, not just the ones meeting the original criteria will be used.
- Running the analysis for other active regions.
