Weekly Report 15Apr2011
RHESSI Albedo Imaging Test
RHESSI Clean Imaging techniques were used to image a large number of flares. For each flare three different detector combinations and two different energy bands were used. The following parameters were used: The flares used were decided upon by the RHESSI response in the 25keV-50keV bands.
- Time: Decided by the peak of the 25keV-50keV energy band for each flare
- Energy: 12keV to 25keV, or 25keV to 50keV
- Detectors: 1 to 9, or 1 to 5,or 6 to 9
- Pixel Size: 2 arcsec by 2 arcsec
- Image Size: 128 pixels by 128 pixels
- Clean Beam Width Factor = 2
Clean images were made with each for each energy band with each detector combination. For each image the centroid of the source was measured, the total flux in the image was measured, and the standard deviation in the x and y direction for each source was measured. Using these measurements the plots below were made.
12keV - 25keV
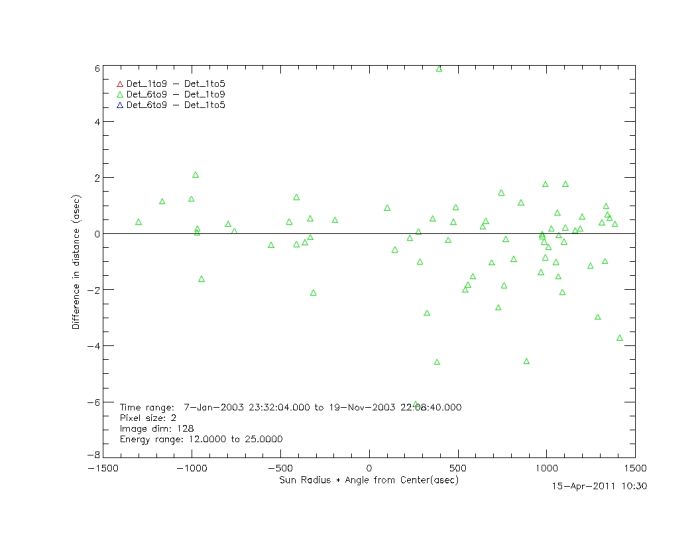
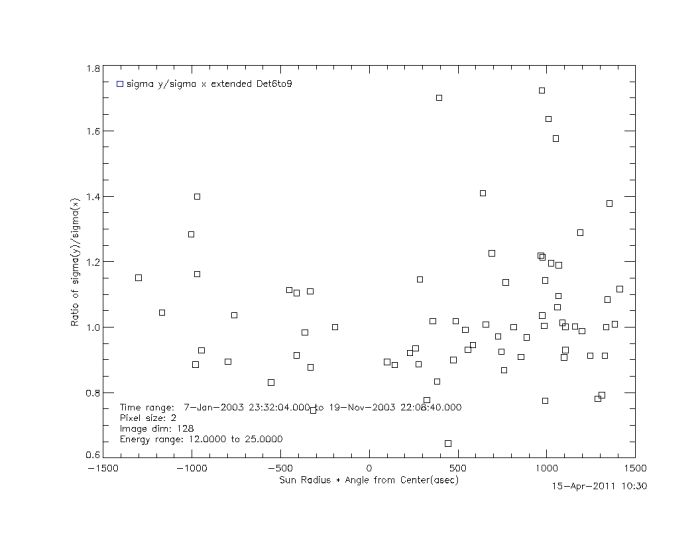
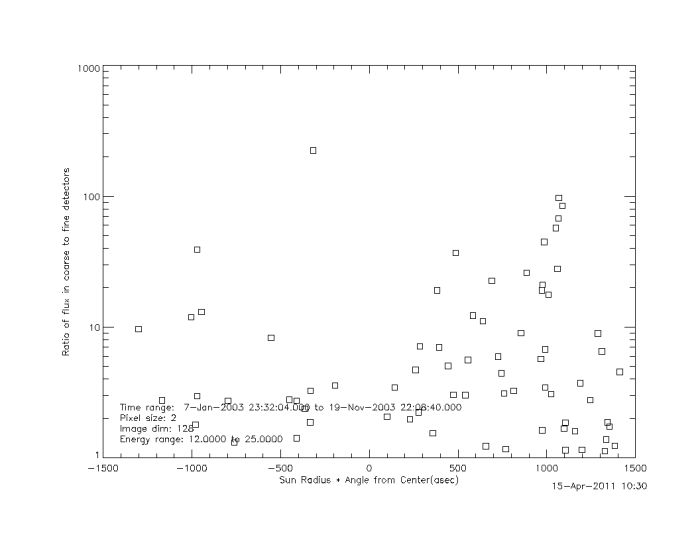
The following are the plots for the 12keV - 25keV energy band. The first three plots show the difference in centroid locations for one detector combination minus another as a function of location on the Sun. The next three show the ratio of the standard deviation in y over the standard deviation in x for each detector combination as a function of position on the Sun. The last shows the ratio of the flux of the extended source (detectors 6 -9) to the compact source (detectors 1-5) as a function of position on the Sun. All plots are discussed below the final plot.
The plot below shows the difference of the centroid using detectors 1 to 9 minus detectors 1 to 5 as a function of position on the Sun.
The plot below shows the difference of the centroid using detectors 6 to 9 minus detectors 1 to 5 as a function of position on the Sun.
The plot below shows the difference of the centroid using detectors 6 to 9 minus detectors 1 to 5 as a function of position on the Sun.
The plot below shows the ratio of the standard deviation in y over the standard deviation in x as a function of position on the Sun for detectors 1 to 9.
The plot below shows the ratio of the standard deviation in y over the standard deviation in x as a function of position on the Sun for detectors 1 to 5.
The plot below shows the ratio of the standard deviation in y over the standard deviation in x as a function of position on the Sun for detectors 6 to 9.
The plot below shows the ratio of the flux in the extended source to the compact source as a function of position on the Sun.
For the above some bad points have been removed. These were selected by looking at images for points in which the distances of the centroids were large compared to the majority of points. Points were excluded if there was a problem with either image. In this case the flare was removed from all analysis. Once flares were removed the flares with large ratios of sigma x to sigma y were looked at closely. Flares near the limb with large ratios for the extended source were looked at closely to see if evidence of foreshortening was present. Currently I'm cross checking these with the displacement of the compact source minus the extended source to see if presence of an extended albedo source is present.
25keV - 50keV
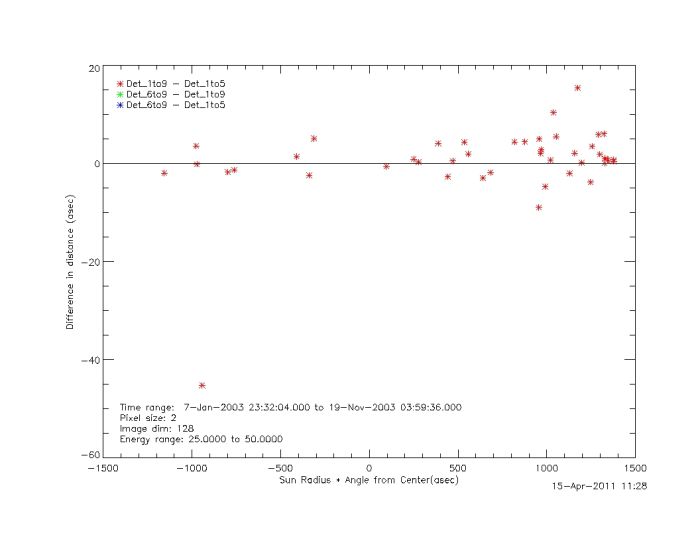
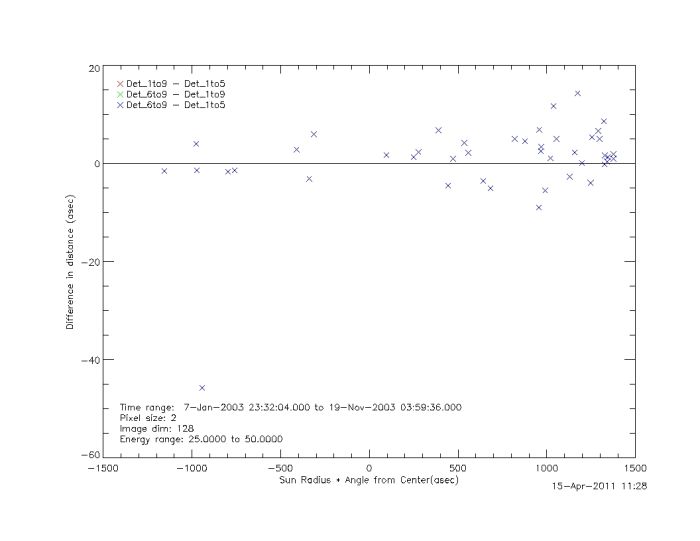
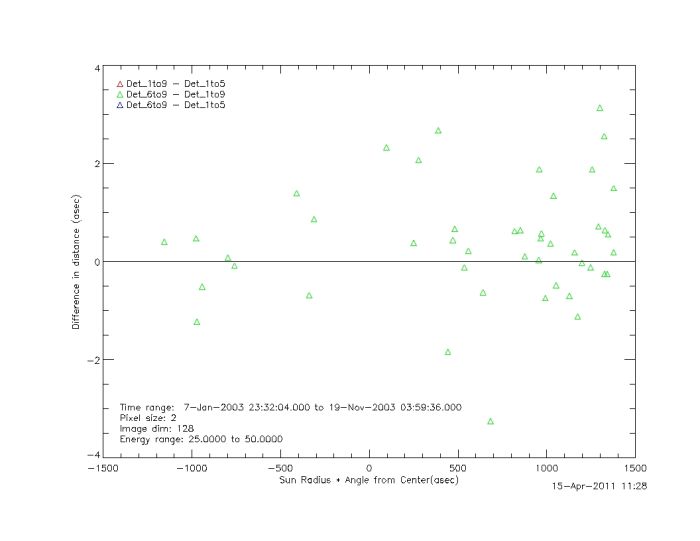
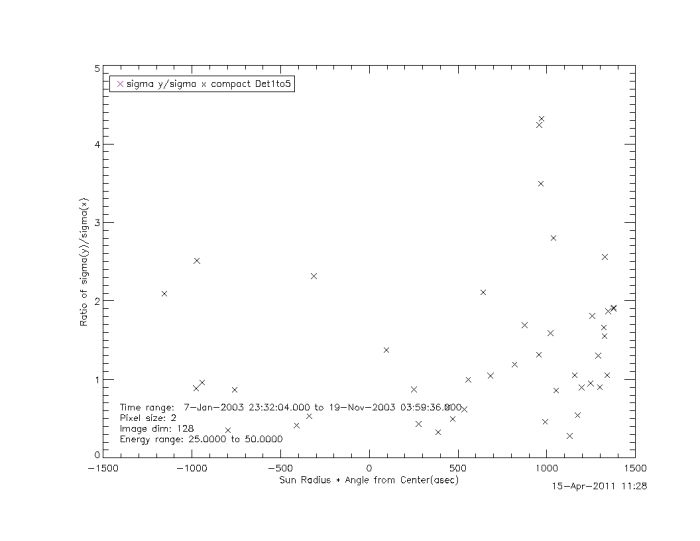
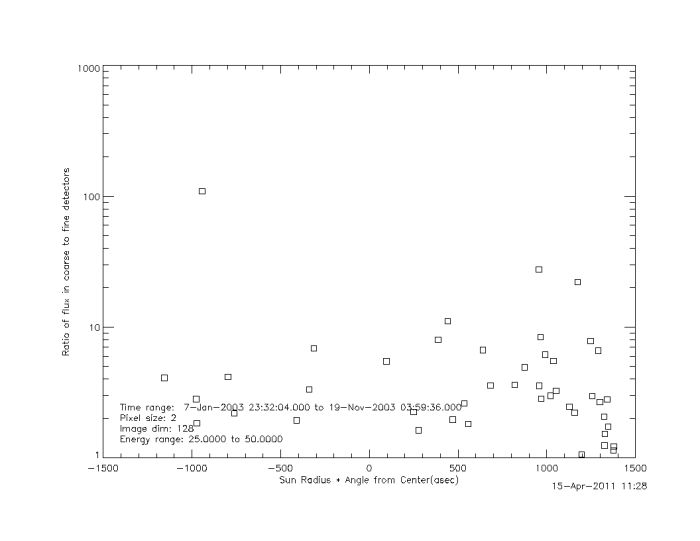
The following are the plots for the 25keV - 50keV energy band. The first three plots show the difference in centroid locations for one detector combination minus another as a function of location on the Sun. The next three show the ratio of the standard deviation in y over the standard deviation in x for each detector combination as a function of position on the Sun. The last shows the ratio of the flux of the extended source (detectors 6 -9) to the compact source (detectors 1-5) as a function of position on the Sun. All plots are discussed below the final plot.
The plot below shows the difference of the centroid using detectors 1 to 9 minus detectors 1 to 5 as a function of position on the Sun.
The plot below shows the difference of the centroid using detectors 6 to 9 minus detectors 1 to 5 as a function of position on the Sun.
The plot below shows the difference of the centroid using detectors 6 to 9 minus detectors 1 to 9 as a function of position on the Sun.
The plot below shows the ratio of the standard deviation in y over the standard deviation in x as a function of position on the Sun for detectors 1 to 9.
The plot below shows the ratio of the standard deviation in y over the standard deviation in x as a function of position on the Sun for detectors 1 to 5.
The plot below shows the ratio of the standard deviation in y over the standard deviation in x as a function of position on the Sun for detectors 1 to 5.
The plot below shows the ratio of the flux in the extended source to the compact source as a function of position on the Sun.
The plots above are for the 25keV-50keV energy band. There are still events which need to be eliminated due to bad images. Only two events have been eliminated so far. There are still flares which need to be examined more closely.
Goals
- Examine the flares near the limb with larger ratios of sigma y to sigma x for the extended source to check for evidence of the albedo
- Complete analysis of 25keV - 50keV flares for flares with large differences in the centroids and check images for evidence of the albedo
- Color code plots by ratio of the extended source to the compact source.


