File:Eve hsi goes plot.png: Difference between revisions
Jump to navigation
Jump to search
imported>Rmilligan (Top panel: lightcurves of free-free, free-bound, and bound-bound emission as observed by EVE during the 15 February 2011 flare. The vertical dashed lines in each panel denote the time of peak emission in each band. Also shown is the GOES 0.1-0.8 nm lightc) |
(Maintenance script uploaded File:Eve hsi goes plot.png) Tag: Server-side upload |
(No difference)
| |
Latest revision as of 14:34, 1 November 2024
Top panel: lightcurves of free-free, free-bound, and bound-bound emission as observed by EVE during the 15 February 2011 flare. The vertical dashed lines in each panel denote the time of peak emission in each band. Also shown is the GOES 0.1-0.8 nm lightcurve (solid black line). The inset shows the cumulative energy radiated throughout the course of the flare by each process. Bottom panel: RHESSI 6-100 keV lightcurves of the same event. The vertical solid black line in each panel marks the approximate onset time of the continuum emission.
File history
Click on a date/time to view the file as it appeared at that time.
| Date/Time | Thumbnail | Dimensions | User | Comment | |
|---|---|---|---|---|---|
| current | 14:34, 1 November 2024 | 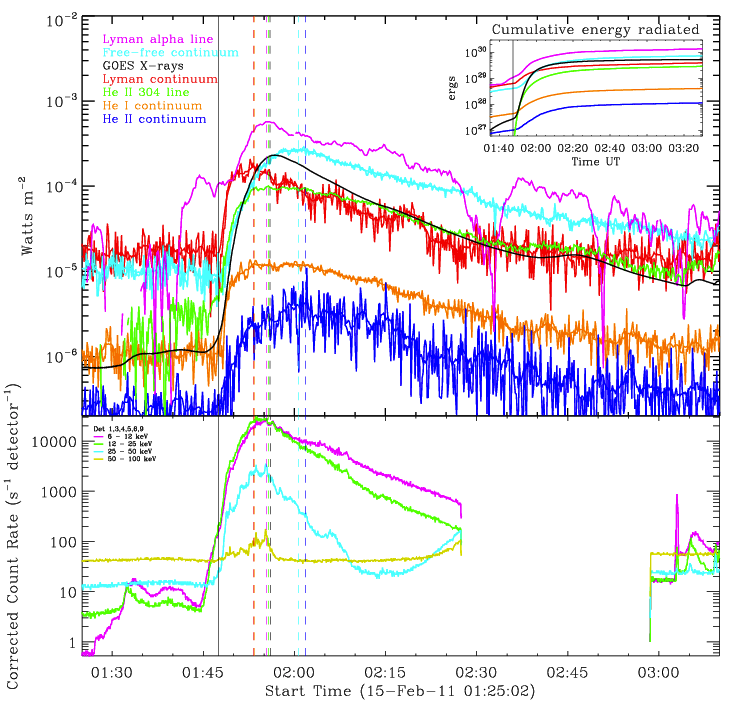 | 733 × 706 (326 KB) | Maintenance script (talk | contribs) | == Summary == Importing file |
You cannot overwrite this file.
File usage
The following page uses this file: