Weekly Report 15Apr2011: Difference between revisions
Jump to navigation
Jump to search
imported>Agopie |
imported>Agopie |
||
| Line 31: | Line 31: | ||
====25keV - 50keV==== | ====25keV - 50keV==== | ||
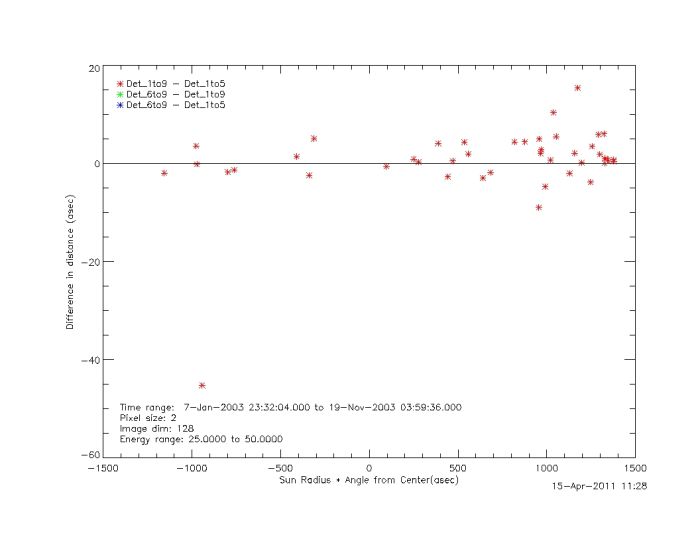
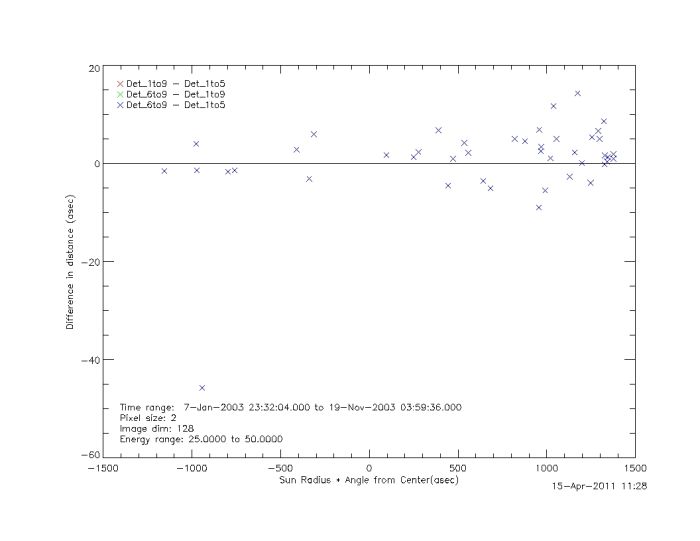
[[File: | [[File:Diffincentroid 25 50 det1to9 det1to5.jpg|center|thumb|700px|]] | ||
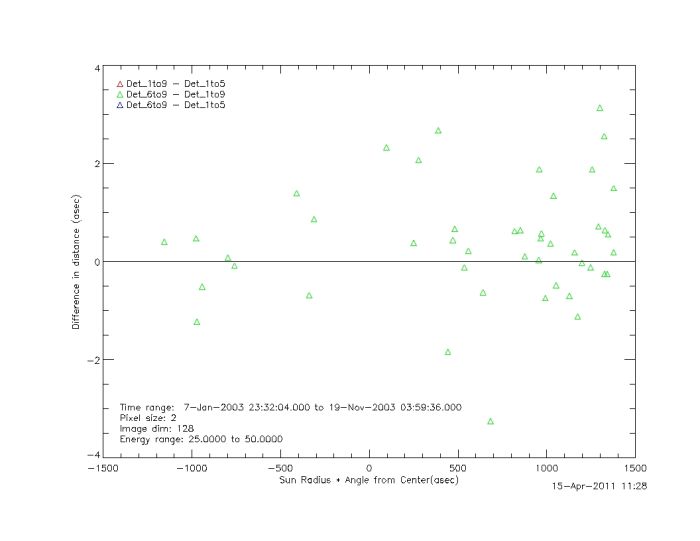
[[File: | [[File:Diffincentroid 25 50 det6to9 det1to5.jpg |center|thumb|700px|]] | ||
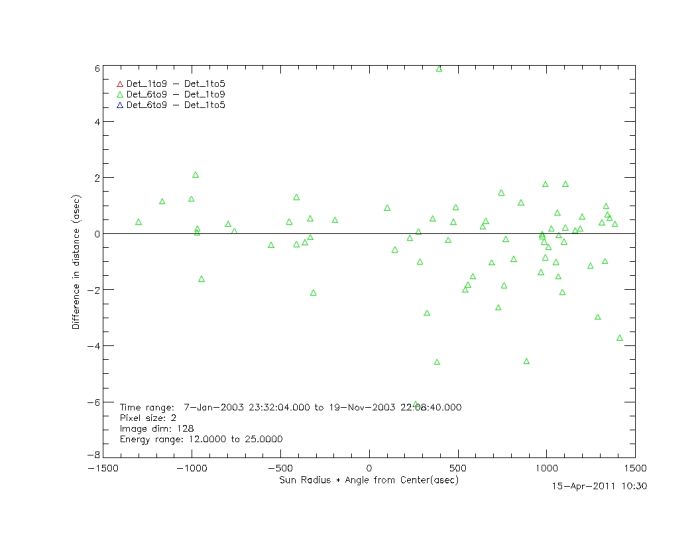
[[File: | [[File:Diffincentroid 25 50 det6to9 det1to9.jpg|center|thumb|700px|]] | ||
[[File:Ratio stdev det1to9 25to50.jpg |center|thumb|700px|]] | |||
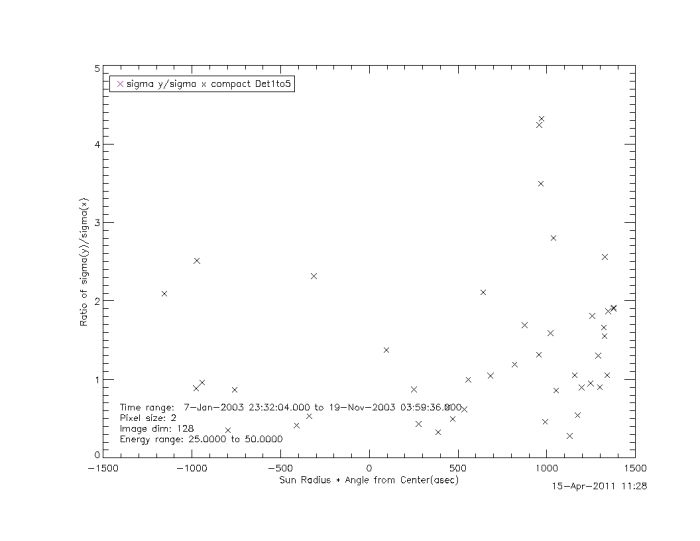
[[File:Ratio stdev det1to5 25to50.jpg |center|thumb|700px|]] | |||
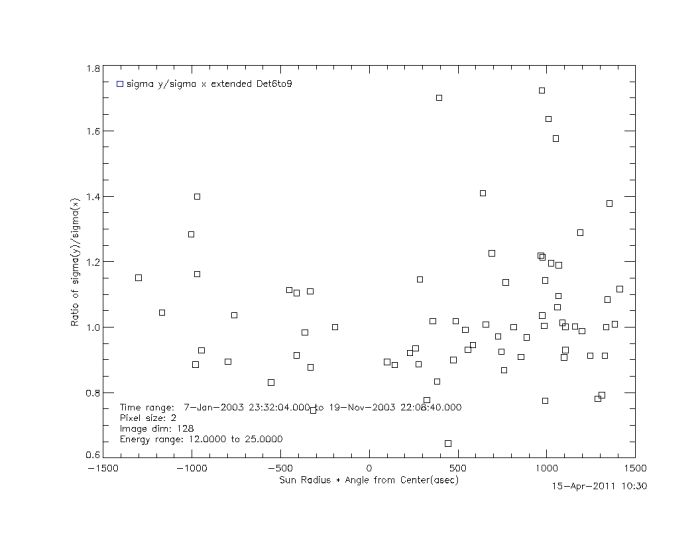
[[File:Ratio stdev det6to9 25to50.jpg|center|thumb|700px|]] | |||
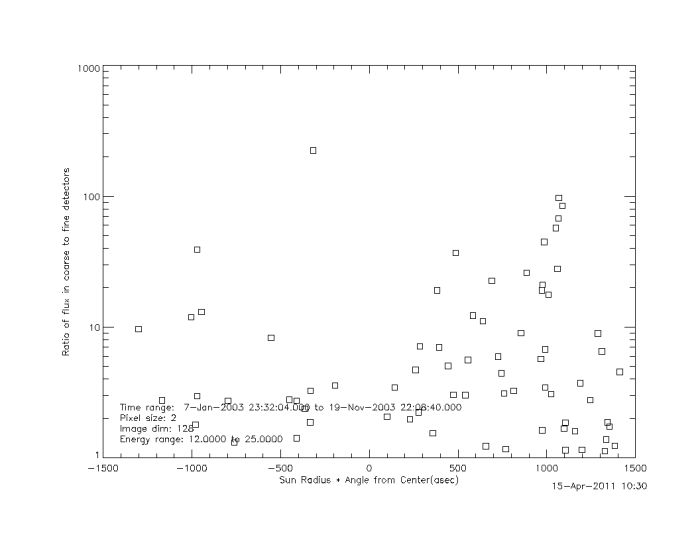
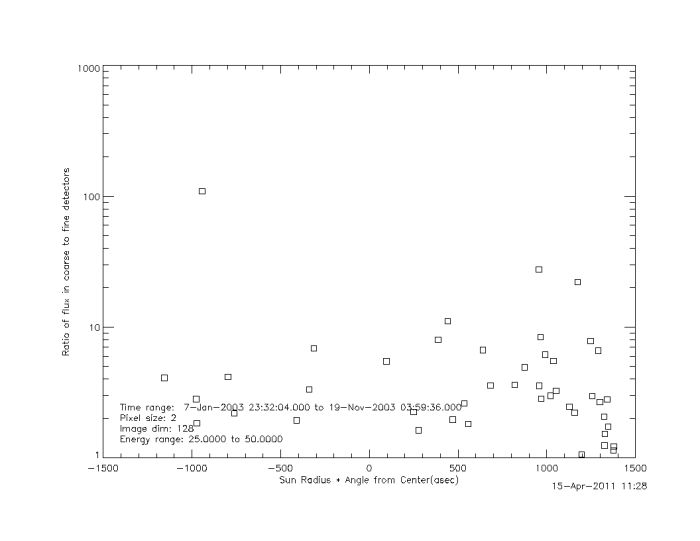
[[File:Ratio coarse fine 25to50kev.jpg|center|thumb|700px|]] | |||
Revision as of 20:18, 18 April 2011
RHESSI Albedo Imaging Test
RHESSI Clean Imaging techniques were used to image a large number of flares. For each flare three different detector combinations and two different energy bands were used. The following parameters were used: The flares used were decided upon by the RHESSI response in the 25keV-50keV bands.
- Time: Decided by the peak of the 25keV-50keV energy band for each flare
- Energy: 12keV to 25keV, or 25keV to 50keV
- Detectors: 1 to 9, or 1 to 5,or 6 to 9
- Pixel Size: 2 arcsec by 2 arcsec
- Image Size: 128 pixels by 128 pixels
- Clean Beam Width Factor = 2
Clean images were made with each for each energy band with each detector combination. For each image the centroid of the source was measured, the total flux in the image was measured, and the standard deviation in the x and y direction for each source was measured. Using these measurements the plots below were made.


