Flare Phases and the Earth's Ionospheric Response
| Nugget | |
|---|---|
| Number: | 504 |
| 1st Author: | Susanna BEKKER |
| 2nd Author: | |
| Published: | September 16, 2025 |
| Next Nugget: | TBD |
| Previous Nugget: | Neupertianity |
Introduction
The Earth's upper atmosphere - realized, surprisingly, only a century ago - is highly ionized. This fact really has had major implications not only for astronomers, but everybody!
We now know that variations in X-ray and EUV irradiance during solar flares lead to increases in the electron density in the sunlit part of the Earth's ionosphere. Until recently, most scientific attention was focused on the impact of the impulsive phase of a solar flare on ionospheric ionisation, while the effect of the EUV late phase remained largely overlooked.
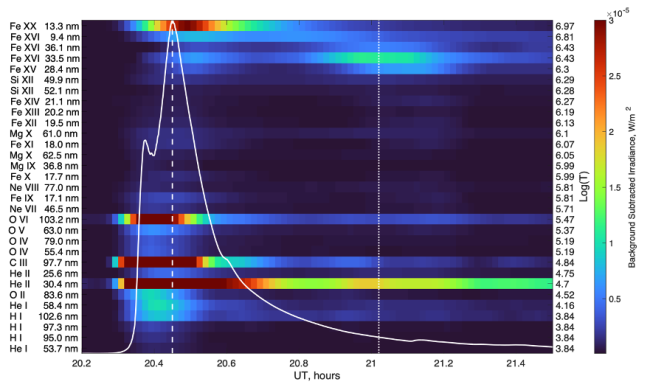
The late phase of a solar flare represents a second significant peak in warm coronal emissions (e.g., Fe XVI 33.5 nm and Fe XV 28.4 nm), reflecting substantially delayed loop energization. It is clearly distinguished from the hot gradual phase directly following the impulsive phase Figure 1 shows an example of an X-class solar flare (SOL2011-11-03) which exhibited a pronounced late phase. Figure 1 illustrates the emission variations relative to background values for 31 solar spectrum lines measured by SDO/EVE during different phases of the X2.9 flare. The maximum X-ray flux in the 0.1 - 0.8 nm range was reached at 20:27 UT, as indicated by the vertical dashed line. The solid white line represents the normalised X-ray flux. Two peaks in warm coronal emissions (Fe XVI 33.5 nm and Fe XV 28.4 nm) are clearly visible. The first peak (~20:29 UT) is associated with plasma cooling after the maximum of the hot X-ray flux, while the second, stronger peak corresponds to the EUV late phase of the flare. The maximum emission flux of Fe XVI 33.5 nm occurred at approximately 21:01 UT, marked by the vertical dotted line.

Ionospheric Response to the Impulsive and Late Phases of a Solar Flare
The most geoeffective emission during the impulsive phase of a solar flare is He II 30.4 nm, which ionises the ionospheric F region and leads to a significant increase in electron density. In contrast, the dominant emission during the late phase is Fe XV 28.4 nm.
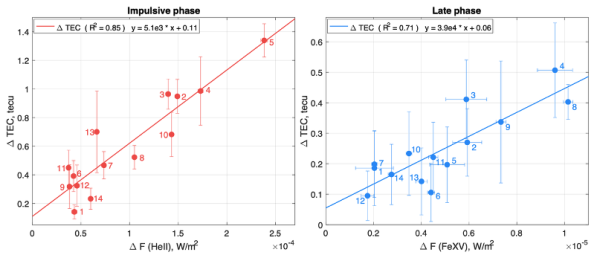
Figure 2 illustrates the empirical relationship between the increase in total electron content (TEC) during the impulsive (left) and late (right) phases, and the corresponding increase in flux in the He II 30.4 nm (F(He II)) and Fe XV 28.4 nm (F(Fe XV)) lines, respectively. The analysis is based on observations of 14 X-class flares.
A clear rise in electron density is observed with increasing radiation flux in the respective spectral lines. Both relationships are statistically significant, which indicates that they can be used to estimate TEC variations during different flare phases, provided that irradiance data for the corresponding solar emissions are available.
Influence of Flare Location on TEC Increase During Different Phases
Another important factor affecting the ionospheric TEC response during different flare phases is the flares location on the solar disk.
The He II 30.4 nm emission originates from the chromospheric footpoints of flare loops and is known to be optically thick. Consequently, for flares occurring near the solar limb (Figure 3C), this emission undergoes stronger absorption as it passes through a greater thickness of the solar atmosphere, compared to flares located closer to the disk centre (Figure 3A). In contrast, the Fe XV 28.4 nm emission is generated in flare loops of the solar corona (Figure 3B, 3D), a low-density region where photon absorption and scattering are minimal. This makes the emission optically thin and thus independent of the flare's location on the solar disk.
Since emissions at He II 30.4 nm and Fe XV 28.4 nm characterise the impulsive and late phases of a solar flare, respectively, the ratio of TEC increases during the late phase relative to the impulsive phase is found to be greater for flares closer to the solar limb. For some limb events, the late-phase effect on TEC was even stronger than that of the impulsive phase, as observed, for example, during the limb flare on 22 September 2011 (Figure 3C, 3D).

Conclusions
There is a close relationship between solar ionizing radiation and the behavior of the Earth's ionosphere (Refs. [1], [2]). We can now detect causes and effects much more clearly, thanks to better observations, and these show that a flare's "EUV late phase" - only recently discovered (Ref. [3]) has a surprisingly strong and heretofore unknown ionospheric counterpart.
References
[3] "Extreme Ultraviolet Late-Phase Flares: Before and During the Solar Dynamics Observatory Mission"
