High-resolution observational analysis of flare ribbon fine structures
| Nugget | |
|---|---|
| Number: | 482 |
| 1st Author: | Jonas THOEN FABER |
| 2nd Author: | |
| Published: | |
| Next Nugget: | Microwave imaging spectroscopy of a really interesting limb flare |
| Previous Nugget: | Advection and super-diffusive expansion as the model of flare accelerated electron transport in type III solar radio bursts |
Introduction
Solar flares may have complicated geometrical structures, involving all layers of the atmosphere. Their manifestation in the chromosphere often takes the form of ribbon-like shapes, paired stripes seen well in hydrogen Hα radiation. In recent years we have come to understand these easily detectable but essentially 2D patterns link interestingly to the 3D corona, which in fact may be the physically more important region.
The flare SOL2022-06-26: Imaging
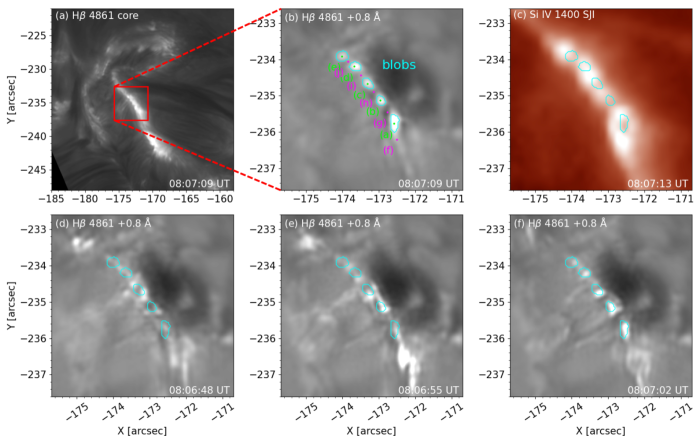
In our recent paper (Ref. [1]) we describe an eruption that occurred in NOAA AR 13040 near disc-centre. This was part of a GOES C2.4-class flare that was co-observed with two of the best high-resolution solar observatories: the Swedish 1-m solar telescope (SST) at La Palma, and the Interface Region Imaging Spectrograph (IRIS) in space. Our study also used context imaging from other sources, such as SDO (also in space). SST is a ground-based telescope and is able to obtain spectral and imaging observation of chromospheric lines, such as Hα, Ca II 8542 Å and Hβ at high temporal, spatial and spectral resolution. These lines provide different views of the fine-scale structures in the flare's ribbons, which we show partially in Figure 1.

On the straight part of the flare ribbon we see remarkable circular kernels with an apparent spatial periodicity. These chromospheric "blobs" can be seen in Figure 1b. They map onto small-scale features in the transition region, as observed by the Si IV 1400 Å from IRIS, seen in panel 1c , although the resolution from this instrument was comparatively limited. Based on the observed structures of the flare ribbons and the periodicity of the blobs, this evidence seems to be consistent with the tearing-mode instability as proposed in Ref. [2. Their analytical model explained the formation of spirals (our blobs) in the flare ribbons as due to oblique tearing in the flare current sheet.
Measurements from the Hβ images yielded widths of the blobs varying from 140-200 km with separation distances ranging from 330-550 km. The temporal analysis of the blobs, utilising the cadence of 7 s, showed that they undergo rapid reconfiguration. The blob evolutions are seen in Figures 1d-1f and 1b, and we judge that their lifetimes are less than about 7 s.
The flare SOL2022-06-26: Spectroscopy
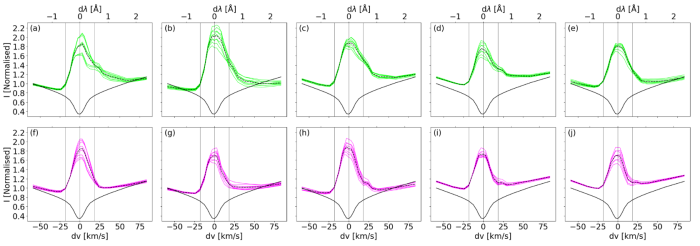
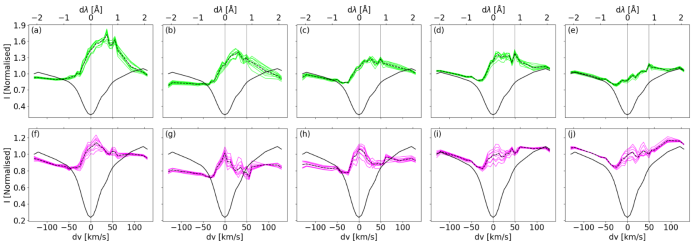
We could do analysis of Ca II 8542 Å and Hβ spectra both at the locations of the blobs and between them. This comparative study showed that the line profiles at the blob locations consist of enhancements in the red line wing. In the case of Ca II 8542 Å profiles, the emission core seems to be accompanied with an enhanced component at about +20 km/s, interpreted as a Doppler shift, as seen in Figure 2; we thus can study the plasma motions during the flare. This component is absent at the locations between the blobs. The Hβ profiles of the blobs showed that the emission peaks are red-shifted between 25-40 km/s (Figure 3). The emission peaks at the locations between the blobs were not red-shifted. Only one blob were identified in the Hα channel images. The profile peak was not identifiable but a red-wing component was detected. This was the case for all locations analysed in Hα along the ribbon.


Conclusion
The details of this work are in Ref. [1]. We think that this observation makes a strong case for the relevance of coronal magnetic instabilities to flare structures in the lower atmosphere.
References
[1] "High-resolution observational analysis of flare ribbon fine structures"
[2] "Is Flare Ribbon Fine Structure Related to Tearing in the Flare Current Sheet?"