Revised Point-Spread Functions of AIA and their effect on DEM analyses
| Nugget | |
|---|---|
| Number: | 478 |
| 1st Author: | Stefan HOFMEISTER, |
| 2nd Author: | Daniel Wolf SAVIN, and Michael HAHN |
| Published: | |
| Next Nugget: | Remarkable NUV flare spectra |
| Previous Nugget: | How much of the energy in flare-accelerated electrons reaches the chromosphere? |
Introduction
Since 2010, the Atmospheric Imaging Assembly AIA has been imaging the Sun in the extreme-ultraviolet (EUV) range, providing valuable insights into the structure and dynamics of the solar corona. These data have had an enormous influence across many branches of solar physics.
However, EUV imaging presents a unique challenge: the imaging wavelength is rather close to the scale of the mirror's roughness, which leads to significant long-distance instrumental scattering. This scattering can artificially increase observed intensities in darker regions, such as the off-limb corona and coronal holes, while reducing intensities in brighter areas, like active regions and flares. Scattering obviously can lead to a serious systematic bias in any quantitative analysis of the beautiful AIA images.
A new treatment of scattering
Previously, it was difficult to quantify this scattering accurately, limiting our ability to correct AIA images for these effects. To address this we have revised AIA's point-spread functions (PSFs), which describe the imaging function of the optics, including its scattering behavior (Ref. [1]).
Using partially lunar-occulted AIA images, we refined the PSF tails and recalibrated the diffraction patterns that arise from the meshes that support the filters. We demonstrate this in Figure 1 for the AIA 171 Â channel. By comparing the scattered-light intensity in lunar-occulted areas to the solar disk's intensity distribution, we first estimate the PSF. Then, we test the accuracy of the PSF by predicting scattered light in other lunar-occulted images, where a well-fitted PSF allows us to accurately predict the observed scattered-light intensity in the occulted regions. In this example, our PSF follows the observed intensity profile well, showing that the PSF is robust.

We applied this method across all AIA channels simultaneously, using 10 lunar-occulted images from 2010-2014 as input to increase the robustness against calibration errors. Each PSF and its uncertainty were calculated by bootstrapping the lunar-occulted images 100 times and then validated on lunar-occulted images from 2015-2023 and on flare images. Our findings reveals that AIA scatters and diffracts approximately 37-55% of light over medium-to-long distances, depending on the AIA channel (see Figure 2). The uncertainties in each AIA channel primarily stem from the dark-current calibration uncertainties.

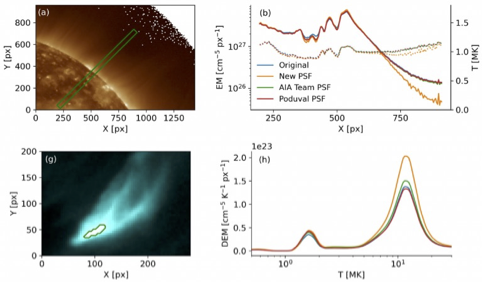
We further evaluated the impact of the updated PSFs on the image quality and subsequent analysis (illustrated in Figure 3). As expected, dark regions become significantly darker, with up to 90% of the observed intensity in coronal holes (at 193 Â) found to be instrumental scatter (not shown here). Bright regions, such as active regions and flares, increase in brightness by about 30%. When applying a differential emission measure (DEM) analysis using the Hannah-Kontar method (Ref. [3]) to the corrected images, off-limb regions showed a faster decreases in emission measure (EM) with distance to the solar disk and slight shifts in the DEM-averaged temperature. For flares, the low-temperature DEM peak remains largely unchanged, but the flare DEM peak increases by about 50% in height, suggesting that PSF corrections do not just increase the image brightness but also lead the DEM algorithm to converge on a solution with a higher plasma content.

Conclusion
EUV imagers like AIA scatter a significant fraction of photons over large angular distances. Correcting for these effects is often important. With PSF deconvolution, dark regions such as coronal holes and off-limb areas appear significantly darker, while bright regions like active regions, flares, and coronal bright points become notably brighter. The improvements described here should have a quantitative impact on analyses of AIA data, especially including DEM studies.
The revised PSFs for AIA, including a description how to use them correctly, can be found here. For full details, see Ref. [1].
References
[2] "Point-spread Functions for the Extreme-ultraviolet Channels of SDO/AIA Telescopes"
[3] "Differential emission measures from the regularized inversion of Hinode and SDO data"