Circular Ribbon Flare at Microwaves
| Nugget | |
|---|---|
| Number: | 387 |
| 1st Author: | Jeongwoo LEE |
| 2nd Author: | |
| Published: | 31 August 2020 |
| Next Nugget: | TBD |
| Previous Nugget: | White-light emission and photospheric magnetic field changes in flares |
Introduction
Circular ribbon flares (CRFs) occur in a special magnetic configuration where a central parasitic magnetic field is surrounded by the major fields in the other polarity (Ref. [1]; see also previous RHESSI Nuggets 278, 381, and 382, for example). Such a configuration implies a dome-shaped separatrix with a null point on top of it; this attracts MHD modelers interested in truly three-dimensional magnetic reconnection expected around the null. Observationally EUV images have mainly been used to study such regions, and the value of microwave observations as diagnostics of CRFs has remained as an open question. We present some results from a microwave study of the CRF, SOL2014-12-17T04:51, using the Nobeyama Radioheliograph (NoRH) and argue that spatial distribution of microwave polarization and its time-dependent change may tell more about magnetic reconnection and eruption in this "fan-spine" structure.
Rapid Polarization Changes
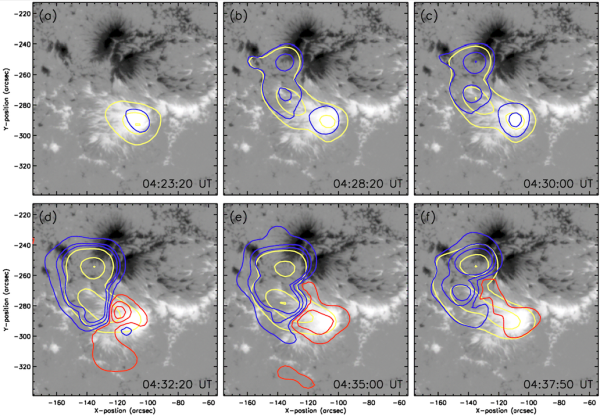
Figure 1 shows contours of the total (yellow contours) and the polarized intensity (red/blue) at 17 GHz as measured by the NoRH. See all sources are left-hand circular polarized (LHCP) in the preflare phase, and on-and-after the flare the southern source over the positive-polarity sunspot becomes right-hand circular polarized (RHCP). In theory, the emission from electrons gyrating about the positive (negative) polarity field should be RHCP (LHCP). Even without such knowledge on the exact sense of polarization, we may still wonder why the single polarization dominates above the bipolar magnetic fields, and are convinced when both polarizations appear. This change of polarization can be understood if the entire region were initially covered with coronal magnetic field with the negative polarity (i.e. the closed fan structure), which is then blown out to let the microwaves emerge in the original polarization. Namely, a breakout-type eruption provides the most plausible explanation for the sudden change of the microwave polarization.
