Spatial and Spectral Evolution of Microwave and X-Ray Sources During the Limb Flare SOL2023-02-05
| Nugget | |
|---|---|
| Number: | 483 |
| 1st Author: | Julia N. SHAMSUTDINOVA |
| 2nd Author: | |
| Published: | |
| Next Nugget: | TBD |
| Previous Nugget: | High-resolution observational analysis of flare ribbon fine structures |
Introduction
We present the results of a study on the energy release and dynamics of a well-observed compact flare located near the solar limb, SOL2023-02-05T03:26 (C6.6). Images from X-rays and microwaves, which are the two spectral ranges that can provide direct tracking of plasma parameters, have been successfully combined in this analysis. The combination of the geometry of the flare, its location and available context data allows us to form a simple, consistent empirical scenario of energy release in solar flares based on this example.
Observational data and analysis
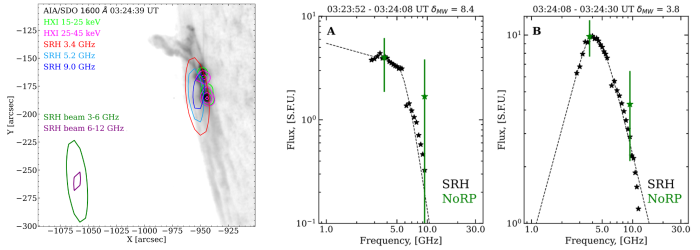
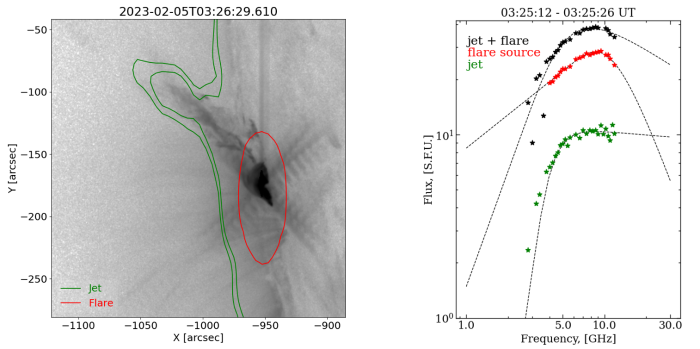
The principal data come from the Siberian Radiotelescope (SRH; 3-12 GHz) and the Hard X-ray Imager (HXI), 10-300 keV, on board the ASO-S spacecraft. The combination of these observations allowed us to obtain plasma parameters using spectral analysis and to study the spatial evolution of the flare. We found that the main source of energy release was a small, compact loop, as it can be seen from the combination of X-ray and microwave data (Figure 1, left panel). Spectral analysis of the microwave emission suggests a transition from thermal gyrosynchrotron emission to non-thermal electron gyrosynchrotron emission during the onset of the flare (Figure 1, right panels). This indicates a transition from plasma heating to particle acceleration. Spectral indices derived from hard X-rays and microwaves agree with each other, confirming the classical soft-hard-soft acceleration model. We found that hardening of the averaged microwave spectrum during the decay phase is due to the contribution of jet emission to the microwave emission (Figure 2).


We note that an earlier SolarNugget also concluded that the microwave view of a hot onset precursor event likely involved thermal gyroresonance emission.
Conclusions
A comparative analysis of 2D data obtained by ASO-S/HXI in X-rays and by SRH in microwaves for a limb flare, where the main source of energy release was a small compact loop, has revealed the following:
• The microwave spectrum behaviour during the pre-flare and impulsive phases of the flare showed a transition from thermal gyrosynchrotron emission to non-thermal gyrosynchroton emission. This indicates a transition from heating to acceleration processes.
• As revealed by the imaging spectroscopy of the microwave data, the hardening of the averaged microwave spectrum seen at the end of the impulsive phase was due to bremsstrahlung jet emission contributing to microwave emission rather than features of the acceleration process. Such a correction results in close agreement between the spectral indices derived from hard X-rays and microwave data, and the classical soft-hard-soft acceleration scenario.
More details are in Ref. [1].